Why the Debt to GDP Ratio matters
By Steve Keen
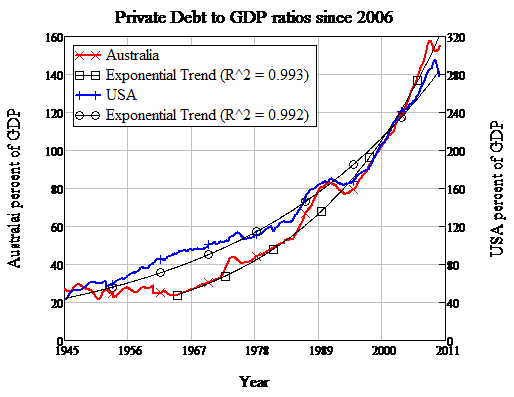
The main feature distinguishing my approach to economics from mainstream theory (known as "neoclassical" economics) is a focus upon the importance of credit in a dynamic, non-equilibrium framework. From this perspective I identify the ratio of debt to GDP — and the rate of change of that ratio — as the key determinant of the state of the economy, and this is what alerted me to the approaching Global Financial Crisis in late 2005. Debt to GDP levels in both Australia and the USA — the two countries for which I could get reliable data — were clearly on an exponential path that I knew had to break and cause a large economic breakdown.

This phenomenon was not taken seriously by conventional economists — which is why the crisis took them by surprise — and they continue to misunderstand why it matters, even as the crisis that they did not see coming continues. Some conventional economists have criticized me for focusing on what they call a "crude" private debt to GDP ratio; others allege that I am making a "schoolboy error" by comparing a stock to a flow. In response, I have developed a simple numerical example that hopefully illustrates why the debt to GDP ratio matters.
- Imagine a country with a nominal GDP of $1,000 billion, which is growing at 10% per annum (real output is growing at 5% p.a. and inflation is 5% p.a.);
- It also has an aggregate private debt level of $1,250 billion which is growing at 20% p.a., so that private debt increases by $250 billion that year;
- Ignoring for the moment the contribution from government deficit spending, total spending in that economy for that year — on all markets, including assets as well as commodities — is therefore $1,250 billion. 80% of this is financed by incomes (GDP) and 20% is financed by increased debt;
- One year later, the GDP has grown by 10% to $1,100 billion;
- Now imagine that debt stabilises at $1,500 billion, so that the change in debt that year is zero;
- Then total spending in the economy is $1,100 billion, consisting of $1.1 trillion of income-financed spending and no debt-financed spending;
- This is $150 billion less than the previous year;
- Stabilisation of debt levels thus causes a 12% fall in nominal aggregate demand.
What about if debt doesn't actually stabilise in the second year, but instead grows at the same rate as GDP? Then we get the following situation:
- In the first year, total demand is $1,250 billion, consisting of $1,000 billion in income and $250 billion in increased debt;
- In the second year, total demand is also $1,250 billion, consisting of $1,100 billion in income and $150 billion in increased debt;
- Nominal aggregate demand is therefore constant;
- But after inflation, real aggregate demand will have contracted by 5%.
This is the real danger posed by debt: once debt becomes a significant fraction of GDP, and its growth rate substantially exceeds that of GDP, the economy will suffer a recession even if the debt to GDP ratio merely stabilizes.
This approach not only explains why the GFC was inevitable, but also gives a very different explanation to preceding crises, and it explains why, to date, Australia has successfully avoided the worst of the GFC while America has suffered from it very badly.
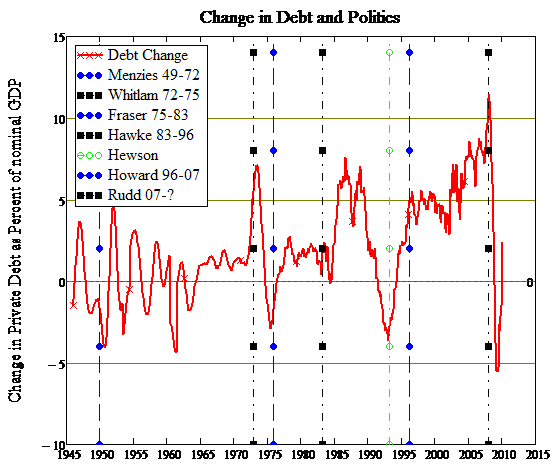
The next chart shows the annual change in the private debt to GDP ratio in Australia, and the changes in government in the last 65 years (blue for a conservative Liberal party victory, black for a progressive ALP victory, and green for one election that the ALP won against the odds). Note that between 1945 and 1965, the ratio rose as often as fell. Then for a decade the debt ratio only rose, before then falling very sharply. Its collapse from a peak rate of growth of 7% p.a. in mid-1973 to minus 3% in mid 1975 was the real caused the mid-1970s recession.
The same pattern repeats from late 1988 till early 1993 — from a growth rate of 7% to falling at 3.5% p.a. in early 1993 — and this gave Australia what its then Prime Minister Paul Keating called "the recession we had to have".
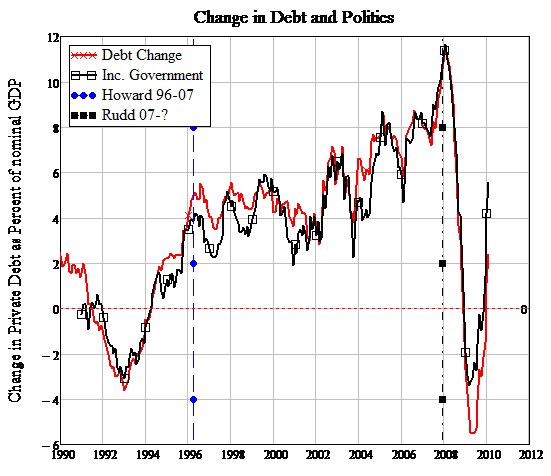
Now to our current crisis, which has been more severe than preceding crises, not because debt was rising more quickly (in fact the rate of growth of debt in the 1970s was much higher than now), but because the debt to GDP ratio is so much higher now. The growth rate peaked at 11.5% p.a. in early 2008, only to fall to minus 5% in mid-2009.

But notice how quickly that decline in Australia's debt ratio has turned into growth once more: whereas Australia experienced 33 months of falling debt to GDP in the 1990s recession, it had only 13 months of a falling debt ratio this time.
The overwhelming reason for this rapid turnaround was the First Home Owners Boost (which I prefer to call the First Home Vendors Boost). This government policy enticed 250,000 Australians into their first mortgage by the offer of an additional A$7,000-14,000 government grant. These new buyers levered this higher deposit into a far higher loan, driving up prices which then provided the vendors from whom they purchased with an additional $30-50,000.
These vendors in turn used this windfall as additional deposits in their own levered purchases. Mortgage debt, which was on track to fall 3% as a proportion of GDP prior to The Boost, instead increased by 6% of GDP — a 9% turnaround that was equivalent to an additional $100 billion stimulus to Australia's A$1.25 trillion economy.
This dramatic turnaround in mortgage debt more than countered deleveraging by the business sector, so that private debt levels rose. On top of that, the government's own debt-financed spending returned the debt contribution to demand to the average of 1996-2006, when the debt ratio grew at roughly 5% p.a. and financed an apparent boom.

So Australia has avoided the GFC by recreating the conditions that led to it. Needless to say, this is not entirely a good thing. We are potentially avoiding pain now by setting ourselves up for greater pain in the near future.
America, on the other hand, is clearly experiencing the worst of the GFC because it is deleveraging — reducing its debt to GDP ratio. Though this is painful, it at least addresses the cause of the crisis — too much private debt — by reducing it rather than increasing it once more.
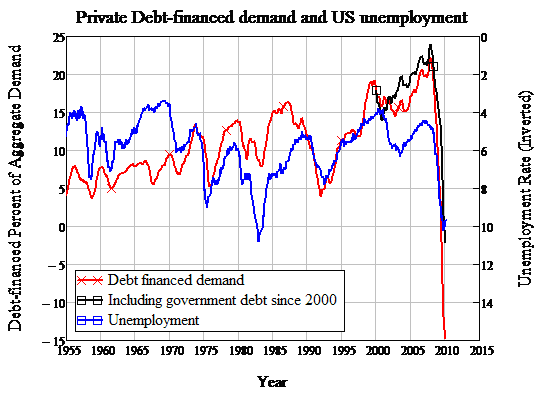
Since America is even more of a Ponzi-dominated economy than Australia, this reduction in private debt — now that the Ponzi Scheme has collapsed — is the key cause of the USA's current slump. This next chart shows the relationship between the proportion of aggregate demand which is debt financed — which I define as the change in debt, divided by the sum of GDP plus the change in debt — and unemployment. The change in private sector debt has gone from boosting aggregate demand by over 20% to reducing it by almost 15%. Only a massive increase in government debt has attenuated the deleveraging.

Whether government spending can continue to counter private sector deleveraging is now a moot point. Some of my non-orthodox economics colleagues argue that a sufficiently large government deficit can return a country to economic prosperity. While I doubt this claim, it is undeniable that if the "deficit hawks" make the government reduce its own spending, then there will be no force standing in the way of accelerated private sector deleveraging.

Author: Colin Twiggs is a former investment banker with almost 40 years of experience in financial markets. He co-founded Incredible Charts and writes the popular Trading Diary and Patient Investor newsletters.
Using a top-down approach, Colin identifies key macro trends in the global economy before evaluating selected opportunities using a combination of fundamental and technical analysis.
Focusing on interest rates and financial market liquidity as primary drivers of the economic cycle, he warned of the 2008/2009 and 2020 bear markets well ahead of actual events.
He founded PVT Capital (AFSL No. 546090) in May 2023, which offers investment strategy and advice to wholesale clients.
