Average True Range (ATR) Bands
Average True Range was introduced by J. Welles Wilder in his 1978 book New Concepts In Technical Trading Systems. ATR is explained in greater detail at Average True Range. Wilder developed trend-following Volatility Stops based on average true range, which subsequently evolved into Average True Range Trailing Stops, but these have two major weaknesses:
- Stops move downwards during an up-trend if Average True Range widens.
I am uncomfortable with this: stops should only move in the direction of the trend. - The Stop-and-Reverse mechanism assumes that you switch to a short position when stopped out of a long position, and vice versa. All too frequently, traders are stopped out early when following a trend and wish to re-enter in the same direction as their previous trade.
Average True Range Bands address both these weaknesses. Stops only move in the direction of the trend and do not assume that the trend has reversed when price crosses the stop level.
Average True Range Band Signals
Signals are used for exits:
- Exit a long position when price crosses below the lower Average True Range Band.
- Exit a short position when price crosses above the upper Average True Range Band.
While unconventional, the bands can be used to signal entries — when used in conjunction with a trend filter. A cross of the opposite band can also be used as a signal to protect your profits.
Example
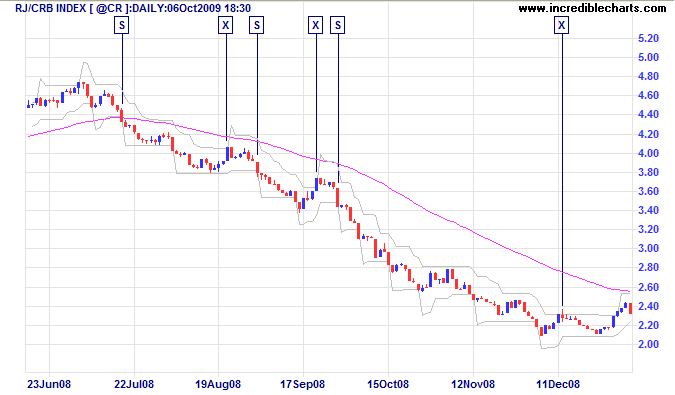
The RJ CRB Commodities Index late 2008 down-trend is displayed with Average True Range Bands (21 days, 3xATR, Closing Price) and 63-day exponential moving average used as a trend filter.

Mouse over chart captions to display trading signals.
- Go short [S] when price closes below the 63-day exponential moving average and the lower band
- Exit [X] when price closes above the upper band
- Go short [S] when price closes below the lower band
- Exit [X] when price closes above the upper band
- Go short [S] when price closes below the lower band
- Exit [X] when price closes above the upper band
No long positions are taken when price is below the 63-day exponential moving average, nor short positions when above the 63-day exponential moving average.
Setup
There are two options available:
- Closing Price: ATR Bands are plotted around the closing price.
- HighLow: Bands are plotted in relation to high and low prices, like Chandelier Exits.
The ATR time period default is 21 days, with multiples set at a default of 3 x ATR. The normal range is 2, for very short-term, to 5 for long-term trades. Multiples below 3 are prone to whipsaws.
See Indicator Panel for directions on how to set up an indicator.
Average True Range Bands Formula
Here is a brief outline:
- Average True Range is calculated in accordance with J. Welles Wilder's formula.
- The bands are calculated by adding/subtracting a multiple of Average True Range to the daily closing price.
- For the HighLow option, the multiple of ATR is added to the daily Low, and subtracted from the daily High.
- A ratchet mechanism ensures that the lower band only moves up in an up-trend and the upper band only moves down in a down-trend.
- Plots are projected one day forward (e.g. the stop caculated from today's closing price is plotted for tomorrow)

Author: Colin Twiggs is a former investment banker with almost 40 years of experience in financial markets. He co-founded Incredible Charts and writes the popular Trading Diary and Patient Investor newsletters.
Using a top-down approach, Colin identifies key macro trends in the global economy before evaluating selected opportunities using a combination of fundamental and technical analysis.
Focusing on interest rates and financial market liquidity as primary drivers of the economic cycle, he warned of the 2008/2009 and 2020 bear markets well ahead of actual events.
He founded PVT Capital (AFSL No. 546090) in May 2023, which offers investment strategy and advice to wholesale clients.
