Chande Momentum Oscillator
Chande Momentum Oscillator is described by Tushar Chande in his book The New Technical Trader. Designed to capture the momentum of a security, Chande Momentum Oscillator uses an approach closer to Welles Wilder's Relative Strength Index (RSI) than the conventional Momentum indicator.
Chande Momentum Oscillator Trading Signals
Tushar Chande uses Overbought and Oversold levels at +50 and -50 on the Chande Momentum Oscillator:
- Go short when Chande Momentum Oscillator rises above the Overbought level at 50; and
- Go long when Chande Momentum Oscillator falls below the Oversold level at -50.
When used with shorter time frames, many traders use crossovers of a signal line, from a 9-period moving average of the Chande Momentum Oscillator, to signal entry points.
Divergences between Chande Momentum Oscillator and price (or trend changes on the Oscillator) warn of reversals.
Chande Momentum oscillating in a narrower band around the zero line, with no penetration of the Overbought and Oversold levels indicates a ranging market. This should not be confused with Chande Momentum oscillating between either the Overbought and the zero line, or the Oversold level and the zero line, which indicates a strong up- or down-trend. The strongest trend signals are from failed swings.
Example
The daily chart of the Australian Dollar (AUDUSD) is plotted with 20-day Chande Momentum Oscillator.
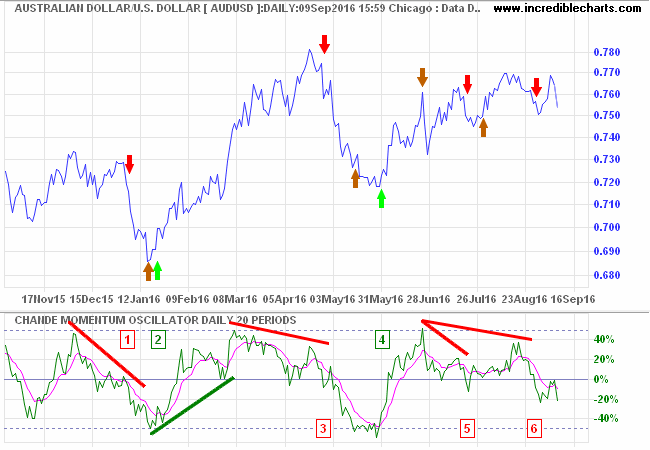
- A lower peak on Chande Momentum Oscillator warns of a sell-off in early January 2016. Go short. Exit when Chande Momentum reaches -50.
- Chande Momentum Oscillator touches the Oversold level at -50 then reverses above its signal line. Go long. Chande Momentum does not reach +50 so exit in late April when a lower peak completes a bearish divergence.
- Go short on the bearish divergence. Exit when Chande Momentum reaches the Oversold level of -50.
- Chande Momentum Oscillator touches the Oversold level at -50 then reverses above its signal line. Go long. Exit when Chande Momentum reaches the Overbought level of +50.
- Go short in mid-July when a lower peak on Chande Momentum Oscillator completes a bearish divergence. Exit when AUDUSD recovers above the entry point at 0.75.
- Go short in late August when a lower peak on Chande Momentum Oscillator completes another bearish divergence. This position is still open.
[Note the signal line was only used when Chande Momentum Oscillator had reached the Overbought or oversold level. Divergences are taken as completed when Chande Momentum reversed below the zero line or 20 points, whichever is greater.]
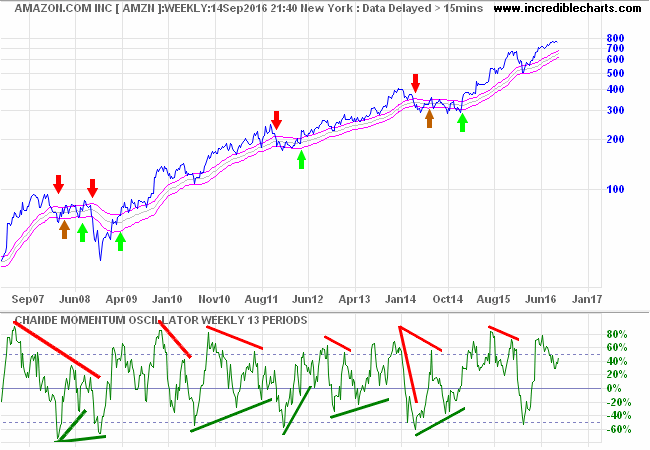
Trend-following: Chande Momentum Oscillator and Keltner Channels
Here we trade a long-term trend with 13-week Chande Momentum Oscillator and 50-week Keltner Channels to signal trend direction.
Use of Overbought and Oversold signals for trend-following shakes you out of your position too early in the trend, with many expensive whipsaws. Instead I have adapted the system specifically to follow trends. I use trend changes on Chande Momentum Oscillator to generate signals and breakouts above/below the Keltner Channel to confirm.
The rules are simple:
- Go long when Chande Momentum Oscillator completes a higher trough and price breaks above the Keltner Channel;
- Go short when Chande Momentum Oscillator completes a lower peak and price breaks below the Keltner Channel;
- Exit long positions if the weekly close is below the Keltner Channel; and
- Exit short positions if the weekly close is above the Keltner Channel.
Troughs or peaks are completed when Chande Momentum reverses across the zero line or by 20 points, whichever is greater.
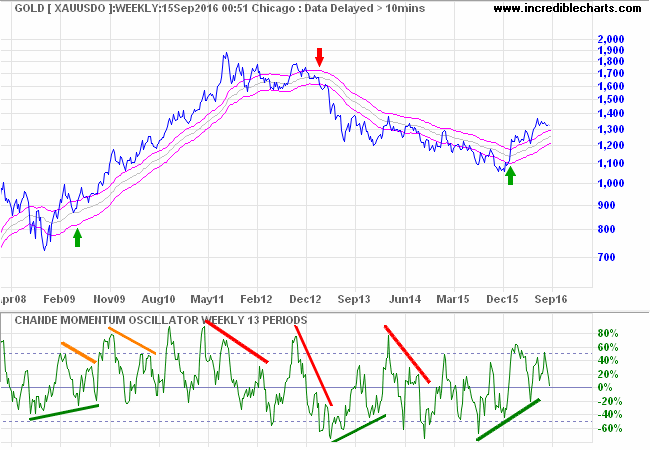
I would only suggest trying this with strong-trending stocks as whipsaws can be expensive — as can be seen from the first two trades on Amazon [AMZN] below. But this is made up by later performance.
I would suggest using 12-month Twiggs Momentum or 13-week Twiggs Money Flow to identify strong-trending stocks.
Setup
Tushar Chande normally uses a time frame of 20 days or weeks. I find 20 weeks tends to lag a bit and prefer to use 13 weeks (a Quarter).
Select Indicators and Chande Momentum Oscillator in the left column of the Indicator Panel. See Indicator Panel for directions on how to set up an indicator. To alter the default settings, see Edit Indicator Settings.
Colors
To amend indicator colors, open the legend by clicking "L" on the toolbar or typing "L" on your keyboard. Adjust individual colors by clicking on the color patches next to the indicator in the legend.
Chande Momentum Oscillator Formula
CHMO = (SU - SD) / (SU + SD)
- Calculate the difference between closing price for the current and the previous period.
- If the change is positive, add it to the sum of up days (SU) for the specified period.
- If the change is negative, add the absolute value to the sum of down days (SD) for the specified period.
- To calculate Chande Momentum for the specified period (normally 20), take the difference, SU - SD, and divide by total movement, SU + SD.
- The result is expressed as a percentage.

Author: Colin Twiggs is a former investment banker with almost 40 years of experience in financial markets. He co-founded Incredible Charts and writes the popular Trading Diary and Patient Investor newsletters.
Using a top-down approach, Colin identifies key macro trends in the global economy before evaluating selected opportunities using a combination of fundamental and technical analysis.
Focusing on interest rates and financial market liquidity as primary drivers of the economic cycle, he warned of the 2008/2009 and 2020 bear markets well ahead of actual events.
He founded PVT Capital (AFSL No. 546090) in May 2023, which offers investment strategy and advice to wholesale clients.