KST Indicator
Martin Pring's KST indicator combines the Rate Of Change Oscillator ("ROC") for four different time periods into one smoothed indicator. The aim is to signal major trend moves on a timely basis while eliminating most of the whipsaws associated with shorter-term oscillators.
KST Indicator Trading Signals
The KST indicator is primarily used to trade trends and should not be used in a ranging market. Signals are taken when KST crosses its signal line, calculated as a 9-month simple moving average of KST.
Trending Market
First check whether price is trending. If the KST indicator is flat or stays close to the zero line, the market is ranging and signals are unreliable.
Go long when KST crosses above its signal line from below.
Go short when KST crosses below the signal line from above.
Signals are strengthened when the signal line also reverses direction.
Example
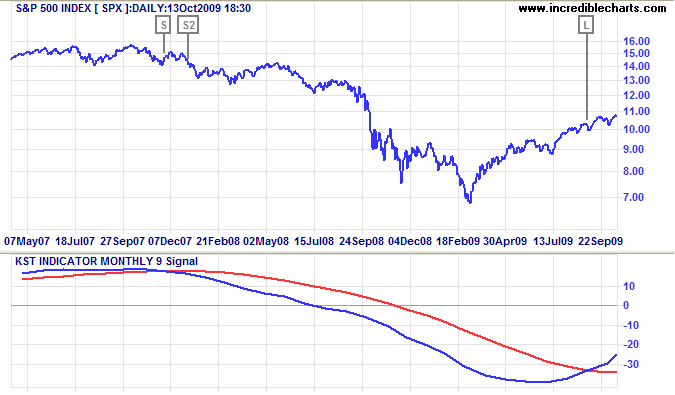
The S&P 500 index is plotted with the KST indicator and 9-month signal line.

Mouse over chart captions to display trading signals.
- Go short [S] when KST crosses below its signal line
- The signal is strengthened when the indicator line also turns downward
- Go long [L] when KST crosses above the signal line.
Setup
The default settings for the KST indicator are:
- 9-Month ROC
- 12-Month ROC
- 18-Month ROC
- 24-Month ROC
- The first three are smoothed by a 6-Month Simple Moving Average
- The last ROC uses a 9-Month Simple Moving Average
- The Signal Line uses a 9-Month Simple Moving Average.
See Indicator Panel for directions on how to set up an indicator — and Edit Indicator Settings to change the settings.
KST Indicator Formula
- Calculate the Rate Of Change indicator for 9, 12, 18, and 24 months.
- Smooth the first three ROCs with a 6-Month Simple Moving Average.
- Smooth the 24-Month ROC with a 9-Month Simple Moving Average.
- Weight the four Smoothed ROCs according to their period.
The sum of the four periods is 63 months, so values for the 9-Month Smoothed ROC will be multiplied by 9/63, the 12-Month ROC by 12/63, and so on... - Sum the weighted values to calculate the KST indicator.
- Calculate the signal line using a 9-Month Simple Moving Average of KST.
Evaluation
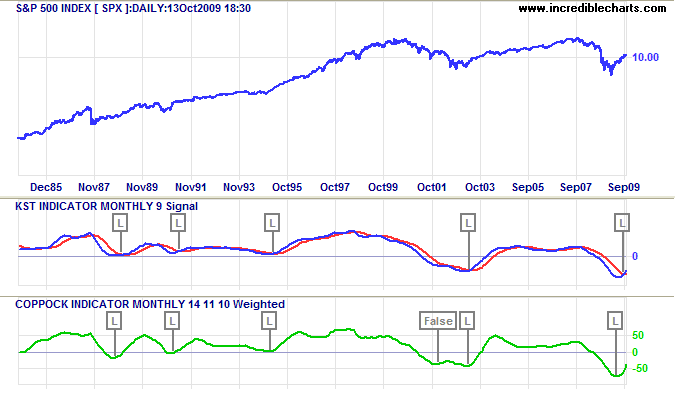
I find that the KST suffers from the same failing as most trend-following indicators: it whipsaws too often, especially in an up-trend. Comparing trend start signals to the long-term Coppock Indicator on the S&P 500 index for the last 25 years, KST reacts slower, but avoids the false signal late 2001 when Coppock turns up while below the zero line.

Mouse over chart captions to display trading signals.

Author: Colin Twiggs is a former investment banker with almost 40 years of experience in financial markets. He co-founded Incredible Charts and writes the popular Trading Diary and Patient Investor newsletters.
Using a top-down approach, Colin identifies key macro trends in the global economy before evaluating selected opportunities using a combination of fundamental and technical analysis.
Focusing on interest rates and financial market liquidity as primary drivers of the economic cycle, he warned of the 2008/2009 and 2020 bear markets well ahead of actual events.
He founded PVT Capital (AFSL No. 546090) in May 2023, which offers investment strategy and advice to wholesale clients.
