Mass Index Indicator
The Mass Index attempts to predict reversals by comparing the trading range (High minus Low) for each period. Reversals are signaled by a bulge in the index line.
The Mass Index was invented by Donald Dorsey.
Trading Signals
The key signal is a reversal bulge. This occurs when the Mass Index (25 period) rises above 27 and falls back below 26.5.
Calculate a 9 day exponential moving average (EMA) of prices:
- Go long if there is a reversal bulge and EMA points downward.
- Go short if there is a reversal bulge and EMA points upward.
Use ATR Trailing Stops to time your entry and Stop Losses on all trades.
Example
FedEx with 25 day Mass Index, and 9 day exponential moving average.
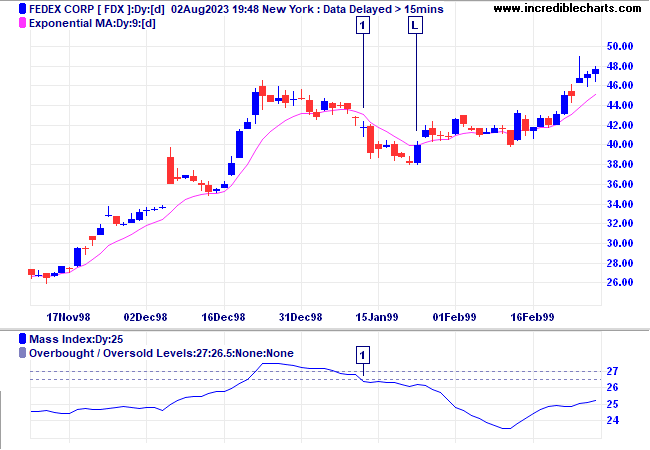
Reversal bulges are very infrequent:
- Long signal - Mass index completes a reversal bulge at [1] while the moving average slopes downward. Place a trailing buy-stop above the High of the signal day and move it down above the high of each day until we are stopped in at [L].
Setup
The default settings are:
- indicator window - 25 days
- upper level - 27.0
- lower level - 26.5
To alter the default settings - Edit Indicator Settings. See Indicator Panel for directions on how to set up an indicator.
Formula
To calculate the Mass Index:
- Calculate the range for each period:
High - Low - Calculate a 9 day
exponential moving average of the range:
EMA [H - L] - Calculate a 9 day
exponential moving average of the above:
EMA ( EMA [H - L] ) - Divide the first: EMA by the second:
EMA [H - L] / EMA ( EMA [H - L] ) - Add the values for the selected number of periods (normally 25).

Author: Colin Twiggs is a former investment banker with almost 40 years of experience in financial markets. He co-founded Incredible Charts and writes the popular Trading Diary and Patient Investor newsletters.
Using a top-down approach, Colin identifies key macro trends in the global economy before evaluating selected opportunities using a combination of fundamental and technical analysis.
Focusing on interest rates and financial market liquidity as primary drivers of the economic cycle, he warned of the 2008/2009 and 2020 bear markets well ahead of actual events.
He founded PVT Capital (AFSL No. 546090) in May 2023, which offers investment strategy and advice to wholesale clients.