Coppock Curve Indicator
Edwin Coppock developed the Coppock Indicator with one sole purpose: to identify the commencement of bull markets. The indicator was devised for use on the Dow Jones Industrial Average but is suitable for use on other market indices or averages.
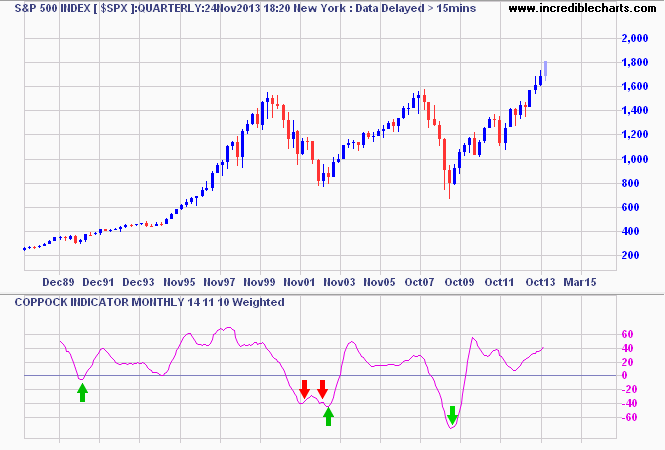
Although often late, the Coppock Indicator has produced reliable signals in the past, but two false signals in 2001/2002 — see the red arrows below — showed that no indicator is infallible.
Coppock Curve Trading Signals
A bull market is signaled when the Coppock Indicator turns up from below zero.
Example
Setup
The default indicator settings are given above. To alter the default settings - Edit Indicator Settings. See Indicator Panel for directions on how to set up the indicator.
Coppock Indicator Formula
To calculate the Coppock Indicator:
- Calculate 14 month Rate of
Change (Price) for the index. Use monthly closing price.
- Calculate 11 month Rate of
Change (Price) for the index. Use monthly closing price.
- Add the results of 1 and 2.
- Calculate a 10 month weighted moving average of the result.
There are a number of variations in calculation. For a more timely signal, try substituting the daily equivalent in place of monthly figures: 294 day ROC, 231 day ROC and 210 day weighted moving averages.

Author: Colin Twiggs is a former investment banker with almost 40 years of experience in financial markets. He co-founded Incredible Charts and writes the popular Trading Diary and Patient Investor newsletters.
Using a top-down approach, Colin identifies key macro trends in the global economy before evaluating selected opportunities using a combination of fundamental and technical analysis.
Focusing on interest rates and financial market liquidity as primary drivers of the economic cycle, he warned of the 2008/2009 and 2020 bear markets well ahead of actual events.
He founded PVT Capital (AFSL No. 546090) in May 2023, which offers investment strategy and advice to wholesale clients.