Twiggs® Money Flow
Twiggs Money Flow is Colin Twiggs' derivation of the popular Chaikin Money Flow indicator, which is in turn derived from the Accumulation Distribution line. We are all indebted to Marc Chaikin and Larry Williams for the contribution they have made to the field of technical analysis and price-volume oscillators.
Twiggs Money Flow warns of breakouts and provides useful trend confirmation. It is based on the observation that buying support is normally signaled by:
- increased volume and
- frequent closes in the top half of the daily range.
Likewise, selling pressure is evidenced by:
- increased volume and
- frequent closes in the lower half of the daily range.
After using Chaikin Money Flow intensively for several months, I noticed that the indicator has two weaknesses:
- If price gaps up or down and then closes mid-way between the day's high and low, the indicator records no change. It does not account for gaps.
- CMF also has a tendency to "bark twice". The formula sums Accumulation Distribution for 21 periods and then divides the total by the sum of volume for the identical period. This is very effective in highlighting short- to medium-term accumulation and distribution but leaves the user with the same failing as a simple moving average: unusually high or low data affects the indicator on the day it is added to the indicator period and on the day it is dropped from the calculation. This is far more critical with the money flow indicator than with a moving average and users may witness a surge in the index that is totally unrelated to current price/volume behavior.
Example
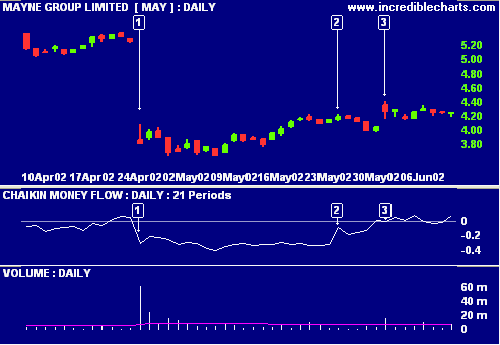
Mayne Nickless (Australia) is plotted with Chaikin Money Flow and Volume.
Mouse over chart captions to display trading signals.
- Chaikin Money Flow drops sharply at [1] as the stock gaps downward on exceptionally high volume, indicating distribution.
- 22 days later at [2], Chaikin Money Flow jumps upwards when the data on day [1] is dropped from the indicator window. There is no unusual volume or price event on day [2].
- Price gaps up with strong volume but Chaikin Money Flow dips - because the close is below the mid-point between the day's high and low. The gap up is ignored.
Two Basic Improvements
Twiggs Money Flow makes two basic improvements to the Chaikin Money Flow formula:
- To solve the problem with gaps, Twiggs Money Flow uses true range, rather than daily Highs minus Lows.
- And, rather than a simple-moving-average-type formula, Twiggs Money Flow applies exponential smoothing, using the method employed by Welles Wilder for many of his indicators.
Example
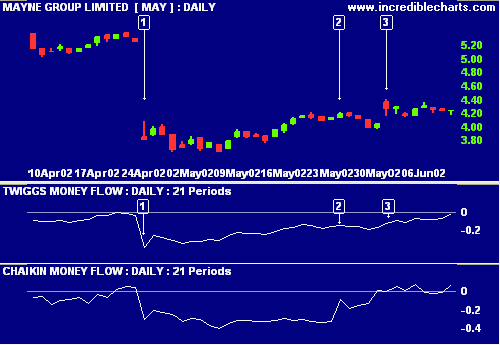
Mayne Nickless (Australia) is plotted with Twiggs Money Flow and Chaikin Money Flow.
Mouse over chart captions to display trading signals.
- The stock gaps downward at [1] on exceptionally high volume. Twiggs Money Flow and Chaikin Money Flow drop sharply, indicating distribution.
- There is no unusual volume or event 22 days later at [2], reflected by the smooth indicator line on Twiggs Money Flow. By contrast, Chaikin Money Flow jumps up sharply at [2] when day [1] data is dropped from the indicator calculation.
- Price gaps up on day [3] with above-average volume. Twiggs Money Flow rises because of the upward gap while Chaikin MF dips (because the Close is below the mid-point between the day's High and Low).
Twiggs® Money Flow Trading Signals
Twiggs Money Flow signals accumulation if above zero, while negative values signal distribution. The higher the reading (above or below zero), the stronger the signal.
- Go long if a breakout above resistance is supported by Twiggs Money Flow above zero.
- Go short if a breakout below support is confirmed by negative Twiggs Money Flow.
Divergences also provide good signals:
- Go long on a bullish divergence.
- Go short on a bearish divergence.
The strongest confirmation of the above signals is when either:
- Twiggs Money Flow is trending upwards and completes a trough without crossing below zero, or
- Twiggs Money Flow trends downwards and completes a peak without crossing above zero.
In other words: when Twiggs Money Flow respects the zero line.
Example
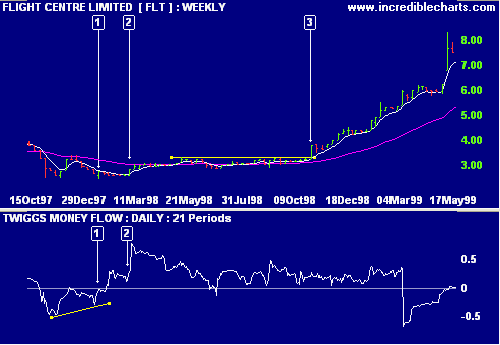
Flight Centre (Australia) with 150-day and 21-day Exponential Moving Averages and Twiggs Money Flow.
Mouse over chart captions to display trading signals.
- Go long at [1] on bullish divergence.
- Twiggs Money Flow has respected the zero line, forming a trough above zero; strong confirmation of the earlier bullish divergence.
- Go long at [3] on breakout above the resistance level (new 6-month high). Twiggs Money Flow has barely crossed below zero in the 10 months prior to the breakout - an exceptionally strong accumulation signal.
Volume Spikes
Beware of large volume spikes - on Twiggs MF or Chaikin MF. A gentle slope back towards zero is not a divergence but is caused by the exponential smoothing: the indicator will tend towards zero, over time, in the absence of other factors. Where there is any doubt about a divergence, check with a longer-term Twiggs MF indicator.
Example
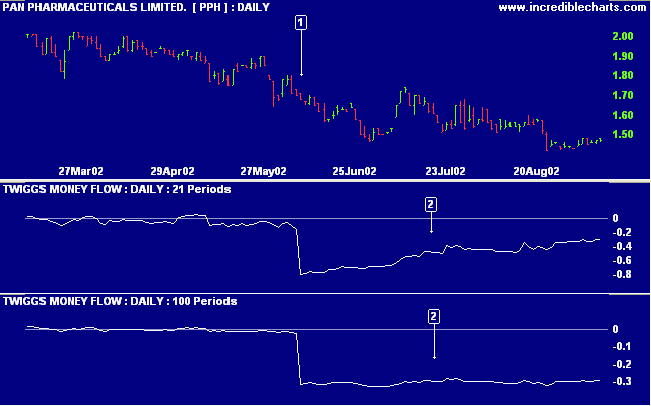
Pan Pharmaceuticals with 21-day Twiggs Money Flow and 100-day Twiggs Money Flow.
Mouse over chart captions to display trading signals.
- A large volume spike (more than 40 times average daily volume), while PPH is trending lower, causes Twiggs Money Flow to drop sharply.
- The gradual upward slope on the 21-day Twiggs MF over the next three months is not a bullish divergence but the result of exponential smoothing: the indicator tends towards zero, over time, in the absence of other factors. This is best illustrated by the longer-term 100-day Twiggs Money Flow which remains almost completely flat over the same period.
Setup
See Indicator Panel for directions on how to set up Twiggs Money Flow. The default setting is:
- 21 days
To alter the default settings - Edit Indicator Settings.
True Range
True Range is the greater of:
- High for the period less the Low for the period.
- High for the period less the Close for the previous period.
- Close for the previous period and the Low for the current period.
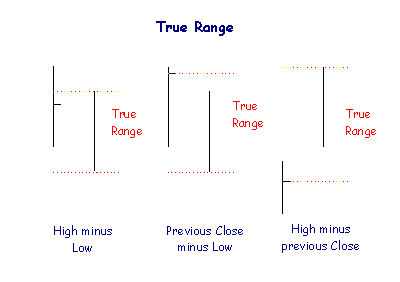
Basically, True Range High (TRH) is the greater of today's High and yesterday's Close.
True Range Low (TRL) is the lesser of today's Low and yesterday's Close.
Twiggs® Money Flow Formula
Twiggs Money Flow substitutes true range for the daily high and low and then applies exponential smoothing, separately, to the sum of Accumulation Distribution and the divisor:
-
Calculate True Range High and True Range Low:
True Range High (TRH) is the greater of:
- High [today] and
- Closing price [yesterday]
True Range Low (TRL) is the lesser of:
- Low [today] and
- Closing price [yesterday]
-
Calculate Accumulation Distribution (AD) using True Range High and True Range Low:
AD = { (Close - TRL) - (TRH - Close) } / {TRH - TRL} * Volume
-
Apply exponential smoothing* to AD:
- Calculate AD[21] as the sum of AD for the first 21 days
- On the next day, multiply AD[21] by 20/21 and add AD for day 22
- Repeat this process for each subsequent day**.
-
Do the same with the divisor:
- Calculate V[21] as the sum of volume for the same 21 day period as in 3. above
- On the next day, multiply V[21] by 20/21 and add Volume for day 22
- Repeat this process for each subsequent day**
-
Divide AD[21] by V[21]:
Twiggs Money Flow = AD[21] / V[21] expressed as a percentage.
MetaStock® Formula
Twiggs Money Flow
https://www.incrediblecharts.com/indicators/twiggs_money_flow.php
{2009-10-15}
periods:=Input("TMF periods",1,100,21);
TRH:=Max(Ref(C,-1),H);
TRL:=Min(Ref(C,-1),L);
TR:=TRH-TRL;
ADV:=((C-TRL)-(TRH-C))/If(TR=0,999999,TR)*V;
If(Wilders(V,periods)=0,0,Wilders(ADV,periods)/Wilders(V,periods))
® MetaStock is a registered trademark of Equis International in the United States and other countries.
Legal Notice
Twiggs® Money Flow is a proprietary indicator. Readers are permitted to explain/describe Twiggs Money Flow on other websites/publications and/or to include/reproduce the formula in other software provided that they display a hyperlink to this web page.

Author: Colin Twiggs is a former investment banker with almost 40 years of experience in financial markets. He co-founded Incredible Charts and writes the popular Trading Diary and Patient Investor newsletters.
Using a top-down approach, Colin identifies key macro trends in the global economy before evaluating selected opportunities using a combination of fundamental and technical analysis.
Focusing on interest rates and financial market liquidity as primary drivers of the economic cycle, he warned of the 2008/2009 and 2020 bear markets well ahead of actual events.
He founded PVT Capital (AFSL No. 546090) in May 2023, which offers investment strategy and advice to wholesale clients.