Premium Stock Charts Advanced simplicity
Incredible Charts is a proprietary suite of indicators and powerful stock screens that give you the insight you need to stay ahead in the markets.
Start with a free plan and upgrade when you’re ready to maximize your potential.

Proprietary Indicators
Proprietary Indicators designed by Colin Twiggs to highlight different aspects of buyer/seller sentiment or enthusiasm.
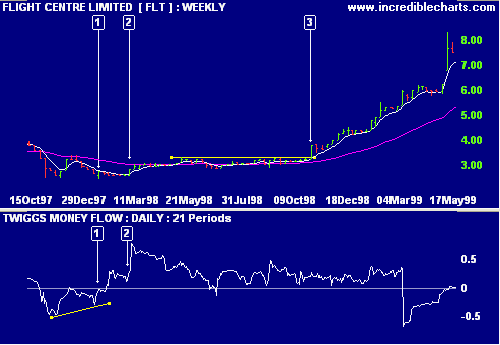
Twiggs® Money Flow
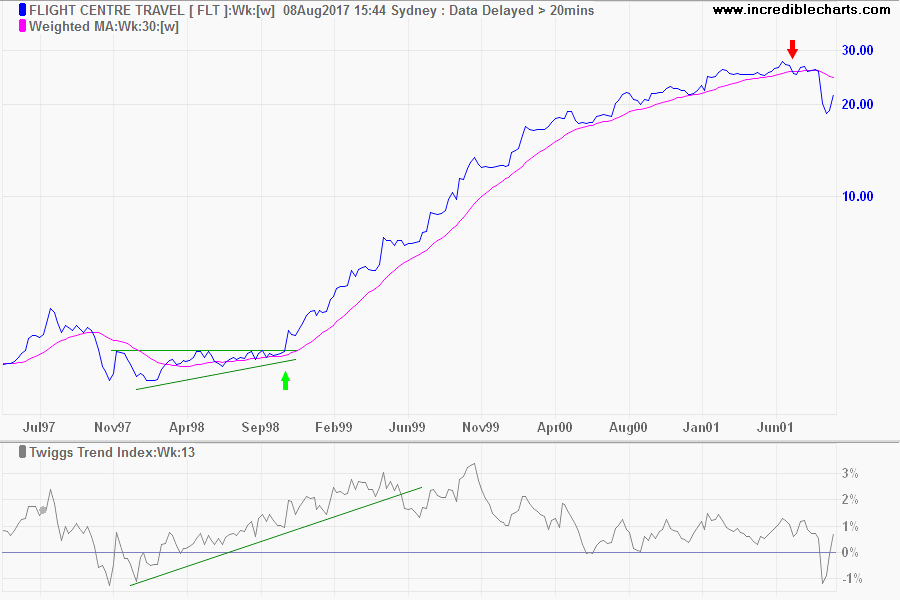
Twiggs® Trend Index
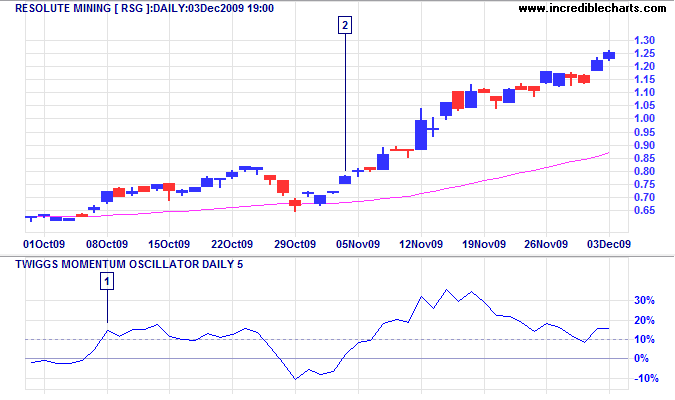
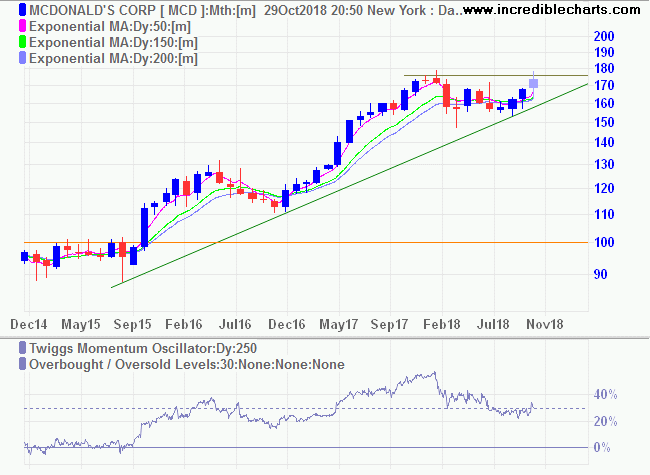
Twiggs® Momentum Oscillator
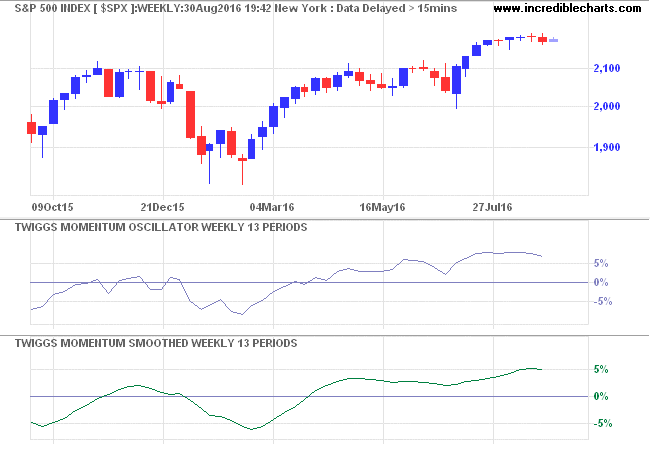
Twiggs® Smoothed Momentum
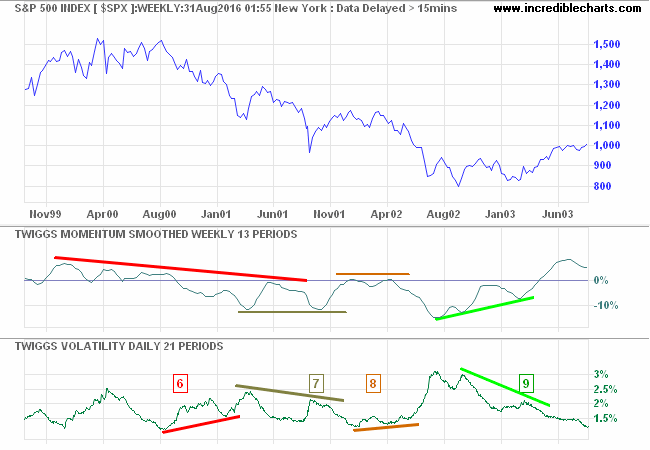
Twiggs® Volatility
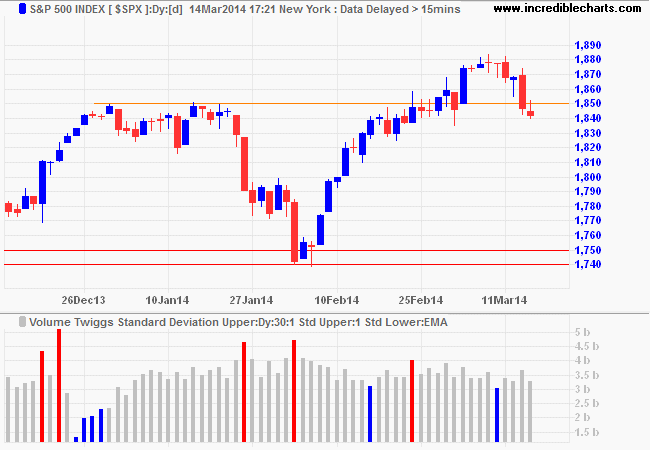
Volume Twiggs® Standard Deviation
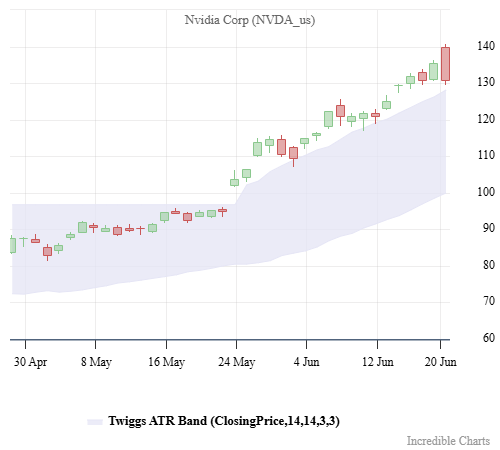
Twiggs® ATR Bands
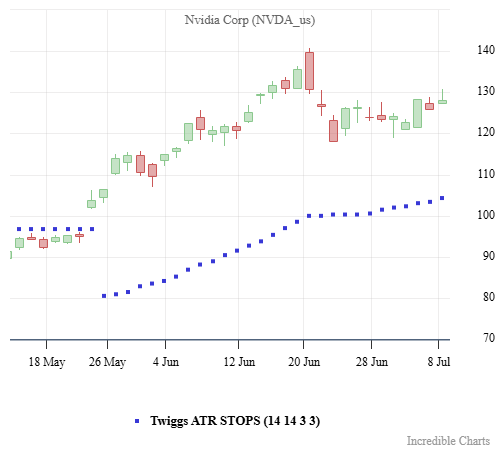
Twiggs® ATR Stops
Powerful Stock Screens & Trading Strategies
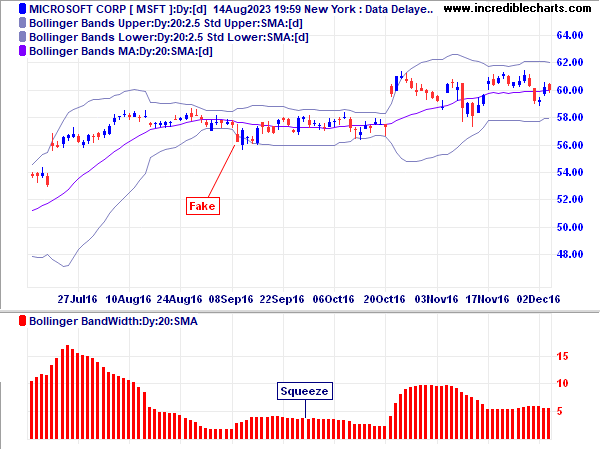
Bollinger Squeeze
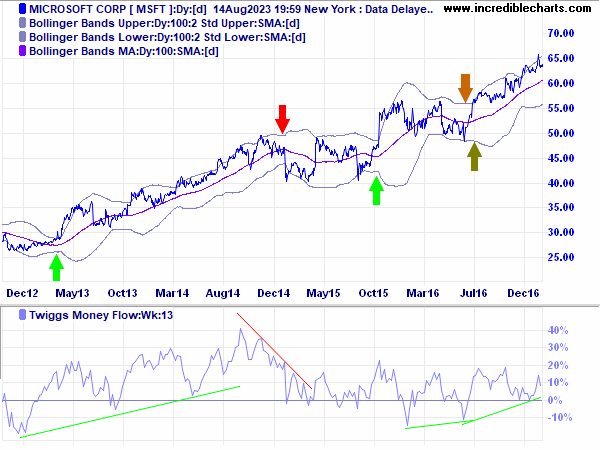
Bollinger Trends
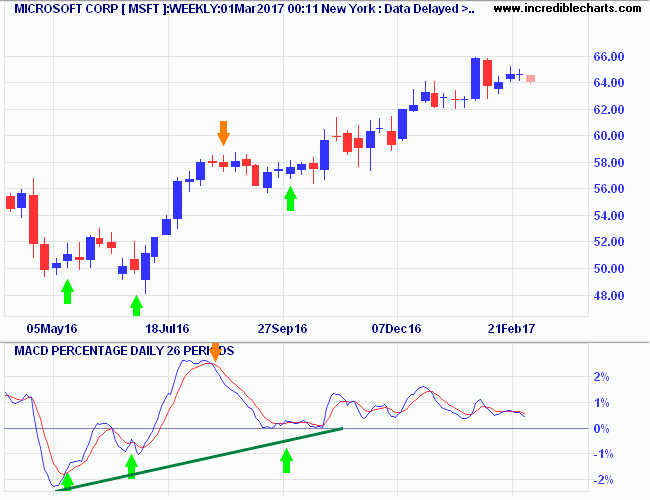
MACD: Two Great Trading Signals
Minervini Trend Template
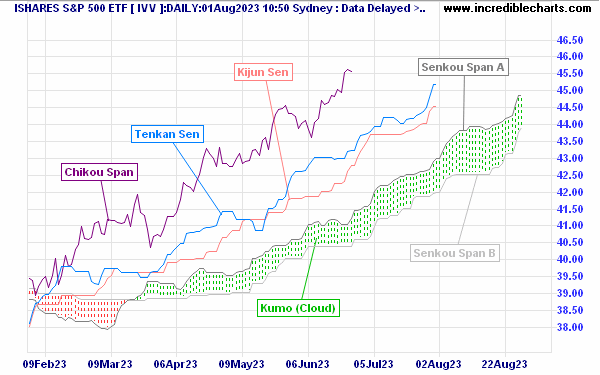
Trend Trading with Ichimoku Clouds
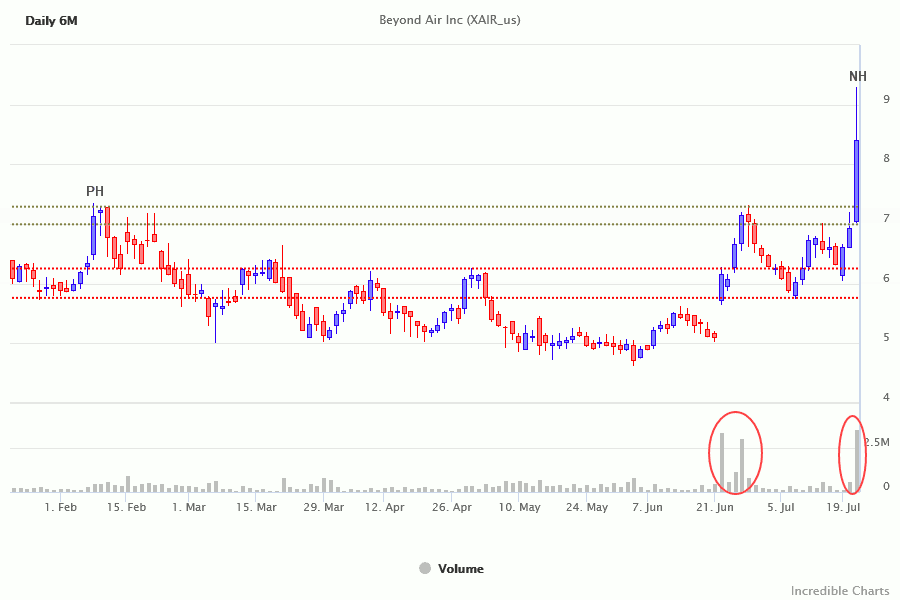
Scan for Breakouts
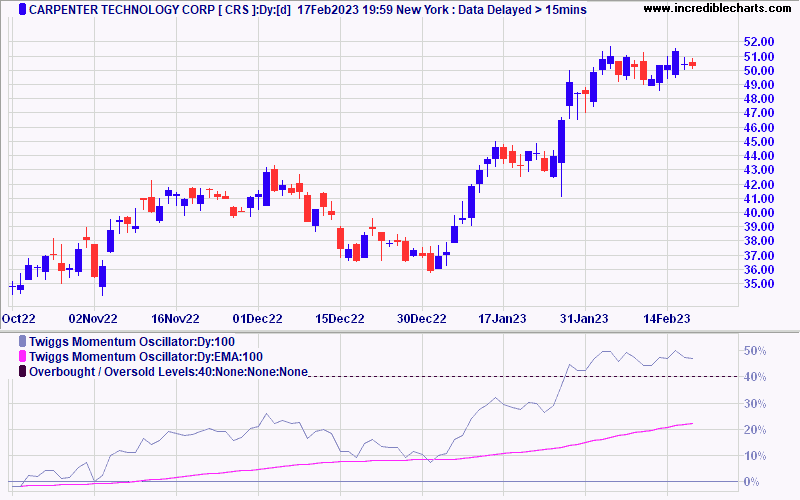
Scan for Momentum
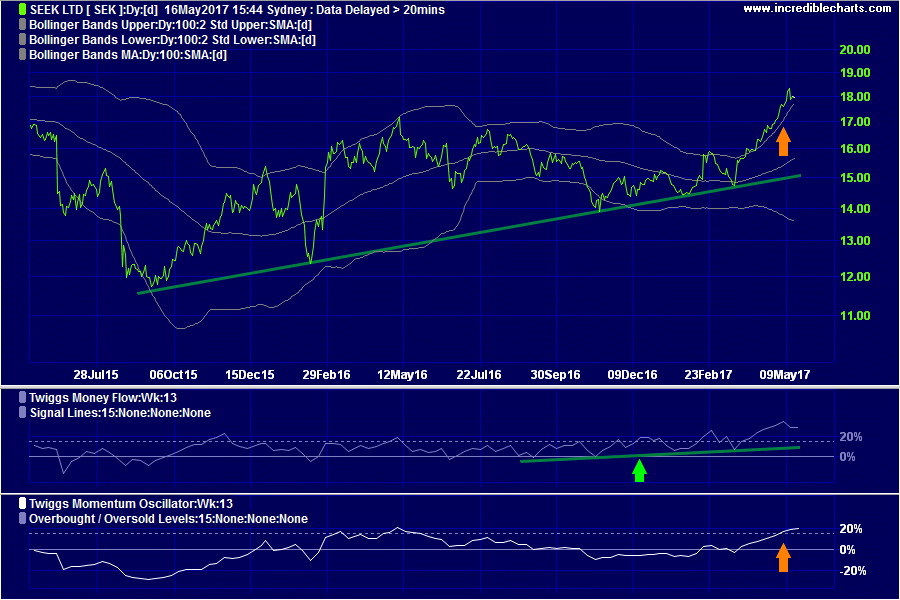
Twiggs Momentum & Money Flow
Surge in Momentum
Scan for Trends
Trading Diary
Colin Twiggs and his team provide free monthly updates to more than 120,000 followers. Join our Trading Diary for:
- Free education
- Macro outlook; and
- Technical updates.
About: Colin Twiggs
Colin Twiggs is a former investment banker with almost 40 years of experience in financial markets. He co-founded Incredible Charts and writes the popular Trading Diary and Patient Investor newsletters.

Using a top-down approach, Colin identifies key macro trends in the global economy before evaluating selected opportunities using a combination of fundamental and technical analysis. Focusing on interest rates and financial market liquidity as primary drivers of the economic cycle, he warned of the 2008/2009 and 2020 bear markets well ahead of actual events.