The Danger Of High Debt Growth
By Colin Twiggs
December 16, 2009
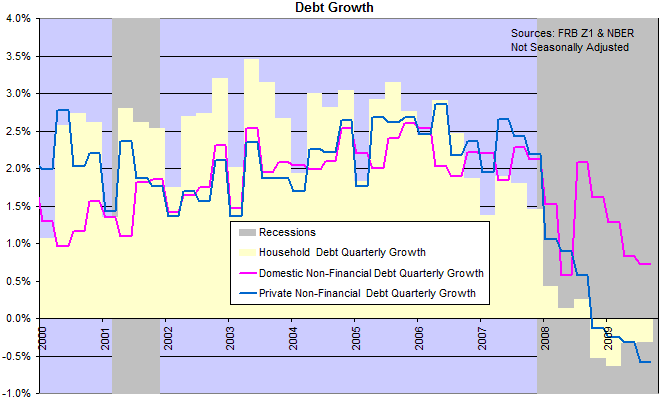
The chart below shows growth in US domestic non-financial debt (pink) up to the end of the third quarter 2009. Financial debt is excluded because this would simply be double counting: the financial sector merely borrows from Peter and lends to Paul. We can see a sharp drop in the first half of 2008 as households and private corporations sold off assets and repaid debt in a falling market. The risk is a deflationary spiral as falling prices spark further sell-offs — which in turn cause further price falls.

The sharp spike in domestic non-financial debt in the second half of 2008 reflects government attempts to stimulate the economy and prevent a deflationary spiral — funded by increased borrowing. The gap between the pink and blue lines reflects growth in government (federal and state) debt. Private sector debt, however, continued falling — despite a slowing of the decline in household debt.
Debt growth is important because it reveals the level of inflationary pressure in the economy. And inflationary pressure indicates future interest rate policy. Between 2003 and 2008 domestic debt grew between 2% and 2.5% per quarter, or 8% and 10% annually. Subtract real GDP growth (pick a number between 0 and 2%) and what you have left is inflationary pressure. This had little effect on consumer prices (other than oil and gas), but had a massive impact on the housing market — fueling the recent bubble.
The 2009 rise in Treasury debt offset falling private sector borrowing, but rising government debt is unsustainable. The only way out is to raise taxes and endure the consequent low growth as consumption is dampened — or hyper-inflation as the central bank debases the currency.

Author: Colin Twiggs is a former investment banker with almost 40 years of experience in financial markets. He co-founded Incredible Charts and writes the popular Trading Diary and Patient Investor newsletters.
Using a top-down approach, Colin identifies key macro trends in the global economy before evaluating selected opportunities using a combination of fundamental and technical analysis.
Focusing on interest rates and financial market liquidity as primary drivers of the economic cycle, he warned of the 2008/2009 and 2020 bear markets well ahead of actual events.
He founded PVT Capital (AFSL No. 546090) in May 2023, which offers investment strategy and advice to wholesale clients.
