The Gold-Oil Ratio
The Link Between Gold and Oil
Gold and crude oil prices tend to rise and fall in sympathy with one another. There are two reasons for this:
- Historically, oil purchases were paid for in gold. Even today, a sizable percentage of oil revenue ends up invested in gold. As oil prices rise, much of the increased revenue is invested as it is surplus to current needs -- and much of this surplus is invested in gold or other hard assets.
- Rising oil prices place upward pressure on inflation. This enhances the appeal of gold because it acts as an inflation hedge.
Gold Price History
The chart below starts with the Yom Kippur war between Israel and its neighbors in 1973 -- and the resulting Arab oil embargo when crude oil rocketed from $3 to $12/barrel. This was followed by the 1978 revolution in Iran and the Iran-Iraq war in 1980 which lasted until 1988. Iraq then invaded Kuwait in 1990, but the ensuing Gulf War had a limited effect on gold prices.
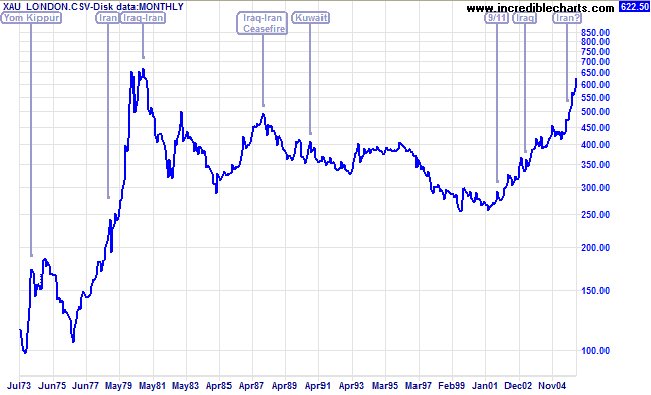
Data Source: Global Financial Data
Gold went into a decline until awakened from its slumber on September 11, 2001. The invasion of Iraq followed in 2003, initiating a strong up-trend, and prices have lately spurred even higher as tensions escalate over Iran's nuclear program.
Oil Price History
Yom Kippur started a huge spike in oil prices with the Arab oil embargo in 1973. This was followed by another spike in 1978 at the time of the Iranian revolution, culminating with the subsequent invasion by Iraq and the start of the Iraq-Iran war. The Saudis substantially increased production in 1985 and the Iraq-Iran ceasefire further eased shortages in 1988. The invasion of Kuwait and ensuing Gulf war caused a brief spike in 1990, but a relatively stable period then followed -- until 1998 when OPEC increased production while demand was falling due to the Asian financial crisis, causing a slump in prices. Subsequent production cuts saw price recover, before September 11 and the 2003 invasion of Iraq heightened fears of further shortages.
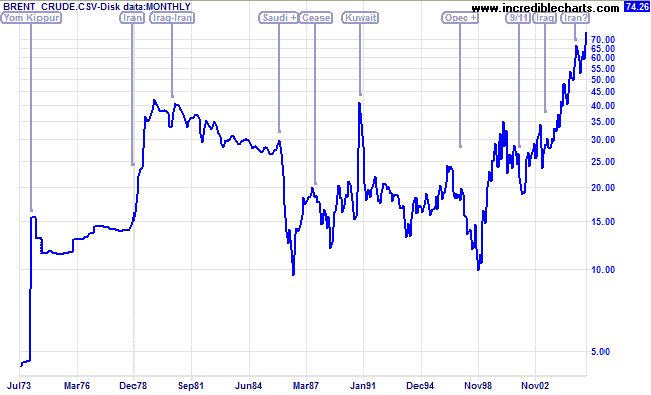
Data Source: Global Financial Data
Readers need to bear in mind that the above prices are not adjusted for inflation. In today's dollars, oil traded at close to $100/barrel and gold above $2000 during the 1980 crisis.
The Gold-Oil Ratio
The easiest way to eliminate inflation from the above charts is to express the two prices as a ratio. How many barrels of oil you can buy with an ounce of gold:
Gold-Oil Ratio = Price of Gold (per oz.) / Price of Crude Oil (per barrel)
The gold-oil ratio helps us to identify overbought and oversold opportunities for gold. The chart below shows solid support between 8 and 10 barrels/ounce of gold over the last 30 years, with occasional spikes carrying above 20 but seldom holding for any length of time.

Gold-Oil Ratio Signals
The gold-oil ratio identifies:
- Buying opportunities (for gold) when the gold-oil ratio turns up at/below 10 barrels/ounce; and
- Selling opportunities when the gold-oil ratio turns down at/above 20 barrels/ounce.
Examples
The Gold-Oil Ratio displayed a buy signal, with values below 10, for most of 2006 to 2008.

A sharp drop in crude prices in late 2008 distorted the ratio, causing an incorrect sell signal. Since then, from mid-2009 to 2011, the ratio has oscillated in a narrow range betweeen 12 and 18.

The Gold-Oil Ratio Setup
The Gold-Oil Ratio has been set up for you in a separate project. Select File >> Open Project >> [Gold-Oil Ratio] on the chart menu or [Gold-Oil Ratio] on the project tabs [>>>>>>>] below the charts.

Author: Colin Twiggs is a former investment banker with almost 40 years of experience in financial markets. He co-founded Incredible Charts and writes the popular Trading Diary and Patient Investor newsletters.
Using a top-down approach, Colin identifies key macro trends in the global economy before evaluating selected opportunities using a combination of fundamental and technical analysis.
Focusing on interest rates and financial market liquidity as primary drivers of the economic cycle, he warned of the 2008/2009 and 2020 bear markets well ahead of actual events.
He founded PVT Capital (AFSL No. 546090) in May 2023, which offers investment strategy and advice to wholesale clients.