Wright's Model
Negative yield curves have proved to be reliable predictors of economic recession over the past 50 years. However, recent experience in the United Kingdom and Australia raises questions as to whether this relationship still applies: both economies have coped with inverted yield curves for some time while enjoying robust growth.
Jonathan Wright, a research economist at the Federal Reserve, in his paper titled The Yield Curve and Predicting Recessions, tested the ability of various models to predict recessions. While his study confirmed a significant and relatively stable relationship between the yield differential (or spread) and subsequent recessions, Wright found an important second variable that substantially improved predictive ability. Wright's model shows that chances of recession are significantly less than when the funds rate is low -- even if the yield differential is negative. This is best illustrated by comparing output from the model with the fed funds rate set at 3.5% and at 5.5%. The spread is calculated as the difference between ten-year and three-month US Treasury securities.
| Probability of recession within the next 4 quarters | ||
| Fed Funds Rate: | 3.5% | 5.5% |
| Spread: 1.0% | 4% | 16% |
| Spread: 0.0% | 17% | 40% |
| Spread: -1.0% | 43% | 70% |
If the fed funds rate is low, the probability of a recession is also low unless the yield curve becomes inverted. However, if the fed funds rate is high, there is significant (40%) probability of a recession when the yield curve is flat, increasing to high probability when the yield curve is negative (70% at -1.0%).
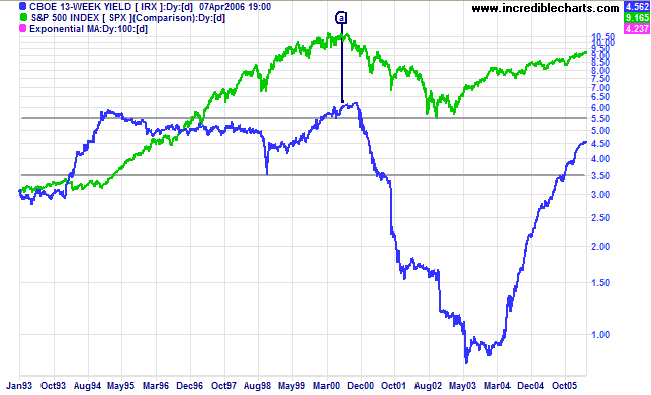
The above chart plots the yield on 13-week T-bills (a fair approximation of the fed funds rate) against the S&P 500 index. The last time the yield curve inverted was at [a] when short-term yields were above 6.0%.
The Yield Curve and Monetary Policy
A flat or inverted yield curve is normally caused by the Fed tightening monetary policy, driving up short-term rates to slow the economy and contain inflation. Recently, however, short-term rates have been at historically low levels and the flat yield curve is due to historically low long-term yields -- caused by low term premiums and low inflation expectations among other factors. Wright holds that when a flat yield curve is caused by factors other than tight monetary policy, its predictive ability is significantly reduced.
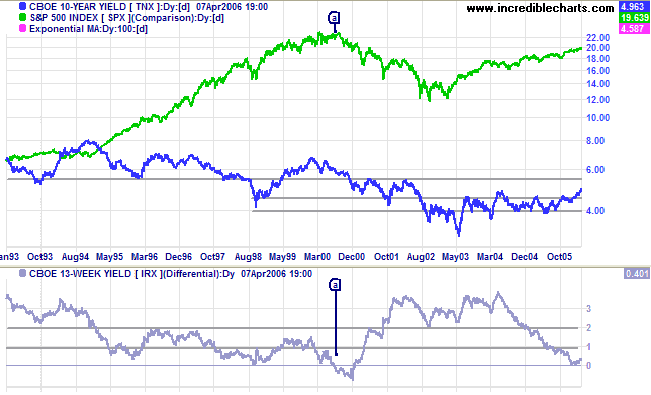
The above chart compares the S&P 500 index to the yield on 10-Year T-Notes and the Yield Differential (between 10-Year T-Notes and 13-Week T-Bills). The yield curve inverted at [a] and was followed by a sharp fall in the S&P 500. Note the historically low long-term yields (below 4.6%) experienced from mid-2002 until early 2006.
Reading a Yield Curve
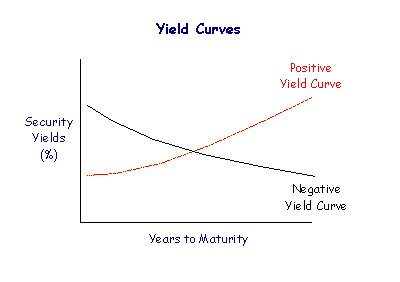
In a normal market, short-term securities yield lower returns than those with longer maturity -- investors require a premium to tie up their money for a longer period (a term premium). If we plot the yields on a graph, you will see that the yield curve slopes upwards, with longer maturities returning higher yields. However, there are times when the market inverts and short-term yields exceed long-term yields. The yield curve then slopes downwards and is referred to as a negative (or inverted) yield curve.
Signals
Negative yield curves have proved to be reliable predictors of future recessions. This predictive ability is enhanced when the fed funds rate is high, signaling tight monetary policy.
- A flat yield curve is a moderate bear signal for equity markets.
Banks suffer from a margin squeeze, as they pay mostly short-term rates to depositors while charging long-term rates to borrowers, and are reluctant to extend new credit. - A negative yield curve is a strong bear signal.
Normally caused by the Federal Reserve raising short-term interest rates to slow the economy, investors may contribute by driving long-term yields down -- switching out of equities into more secure investments. - A steep yield curve is generally bullish for stock investors.
The Fed may drive down short-term interest rates to stimulate the economy and investors contribute by switching out of bonds into equities, causing long-term yields to rise.
Yield Differential (or Spread)
The yield differential plots the difference between ten-year Treasury notes and 13-week Treasury bills as an approximation of the yield curve:
- A yield differential above 2% is a positive sign, indicating a steep yield curve;
- A yield differential below 1% signifies a flattening yield curve;
- A yield differential below zero signals a negative (or inverted) yield curve.

Author: Colin Twiggs is a former investment banker with almost 40 years of experience in financial markets. He co-founded Incredible Charts and writes the popular Trading Diary and Patient Investor newsletters.
Using a top-down approach, Colin identifies key macro trends in the global economy before evaluating selected opportunities using a combination of fundamental and technical analysis.
Focusing on interest rates and financial market liquidity as primary drivers of the economic cycle, he warned of the 2008/2009 and 2020 bear markets well ahead of actual events.
He founded PVT Capital (AFSL No. 546090) in May 2023, which offers investment strategy and advice to wholesale clients.