Frequently Asked Questions: Getting Started
How do I select a stock or index?
- How do I select a stock symbol?
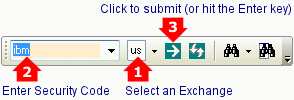
- Select an Exchange on the toolbar
- Enter the security symbol
- Click
 or hit the Enter key.
- How do I search for a stock or index?Use the F3 shortcut key or
 on the toolbar.
 - What exchanges are available?
- ax = Australia
- ao = ASX ETOs & warrants
- ca = Canada
- us = US Equities & Indexes (including NYSE, NASDAQ & AMEX)
- uk = United Kingdom
- cm = Commodities
- fx = Forex
- pm = Precious Metals
- ix = World Indices
How do I add an indicator?
- How do I add an indicator?
- Select Indicators on the chart menu - to open the Indicator Panel
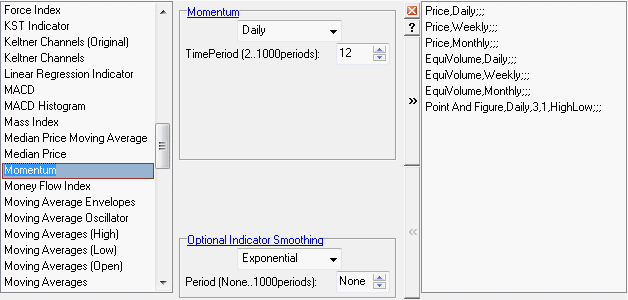
- Select an indicator from the left column
- Adjust the settings in the center pane
- Save the indicator in the right column

- Close the Indicator Panel
 .
.
Example - To create a 100-day Exponential Moving Average:- Select Indicators on the chart menu
- Select Moving Averages in the left column of the indicator panel
- In the center pane, select Daily, Exponential, and enter 100 as the new period
- Save
 and close the panel
  .
.
- How do I add a moving average to an indicator?Select a moving average (e.g. Exponential >> 50) under Optional Indicator Smoothing in the center pane.
- How do I edit an indicator?
- Select Indicators on the chart menu to open the indicator panel
- Select the indicator in the right-hand column.
- Amend the settings in the center panel using the up- or down- arrows or type over the existing numbers.
- Save the new settings

- Close the Indicator Panel

- How do I remove an indicator?
- Select Indicators on the chart menu to open the indicator panel
- Select the indicator in the right-hand column.
- Delete the indicator by clicking the remove button

- Close the Indicator Panel

- How do I change the indicator view?
- Select
 in the left margin for full screen view of a chart or indicator.
 - Select
 to display a split screen view of an indicator and the price chart.
 - Select
 to return to default view with all indicators displayed.
- Select
- How do I change the size of the indicator slots?Drag the border between the price chart and indicator slots up or down with your mouse.
- How do I change an indicator color?
- Open the Legend, from the toolbar
 or by typing "L" on your keyboard
 - Click the color block next to the indicator

- Select a new color from the palette and click OK.
- Open the Legend, from the toolbar
- Why do I have to set up indicators on Daily, Hourly and Minute charts separately?There are 3 data-sets: Days, Hours and Minutes. All other chart intervals are derived from these data-sets:
- Days >> Daily to Annual
- Hours >> 1 to 6 Hours
- Minutes >> 1 to 30 Minutes
This requires you to set up 3 sets of indicators, but does allow you the flexibility of viewing the same indicator (e.g. 24-Hour Twiggs® Momentum) across different Chart Intervals (e.g. 1 to 6 Hours). - Indicator values for the current week, day, hour or minute are not displayed.Where the period is incomplete, indicator values (other than volume) are by default hidden because they can be misleading. To show these values, select View >> Incomplete Periods >> Other Indicators >> Display.
- Why does Price Comparison (or Price Ratio/Price Differential) only display on one stock instead of all stocks?
- Select Indicators on the chart menu
- Select Price Comparison in the right column of the indicator panel and choose the stock or index to add
- Change the Apply to setting from Security to Project in the center pane
- Save the new settings

- Close the panel

How do I change the time frame?
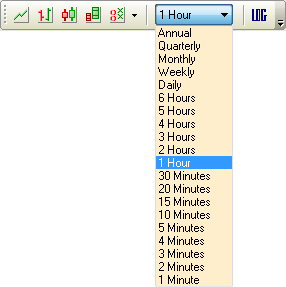
- How do I change the chart interval to Hours, Minutes, Weeks, Months, Quarters or Years?Select a chart interval from the drop-down menu on the toolbar or View >> Chart Interval.
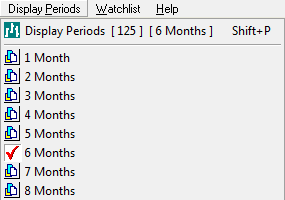
- How do I change the chart time frame?
Select from Display Periods on the chart menu.
How do I change the chart type?
- How do I change the chart type from candlesticks to OHLC, line, equivolume or point & figure?
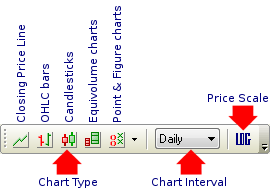
Select a chart type on the toolbar.
- How do I change the price scale from arithmetic to semi-log?
Select the LOG button on the toolbar.

How do I compare two stocks?
- How do I compare or overlay two stocks on a chart?

- Select Price Comparison (Intercept) in the left column of the indicator panel.
- Select a stock or index from the pop-up menu (e.g. $DJI) or Load By Symbol From Incredible Charts.
- Leave the intercept date blank unless you want the comparison to start from a specific date.
- Change Security to Project to display for all stocks in a project.
- Save the indicator

- Close the Indicator Panel

How do I draw a trendline or trend channel?
- How do I draw a trendline?
- Select Draw >> Trendline or
 on the toolbar
 - Click and drag your mouse from the start to end point.
- Select Draw >> Trendline or
- How do I automatically fit a trendline?
- Select Draw >> Autofit Trendline or
 on the toolbar
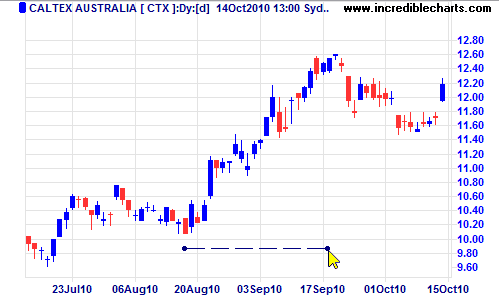
 - Drag your mouse below (up-trend) or above (down-trend) the selected price bars
- Select Closing Price for long-term charts or Highs/Lows for short-term
- The trendline will automatically fit to price bars in the selected time period
- Select Draw >> Autofit Trendline or
- How do I draw a horizontal trendline?
- Select Draw >> Horizontal Line or
 on the toolbar
 - Click your mouse at the start point.
- Select Draw >> Horizontal Line or
- How do I draw a vertical trendline to display on all charts in a project?
- Select Draw >> Vertical Line or
 on the toolbar
 - Click on the desired point on the chart to draw a verical line
- Right-click on the vertical line
- Select Apply to Project on the list of properties

- Select Draw >> Vertical Line or
- How do I draw a linear regression line with trend channels on either side?A Standard Deviation Channel with channel lines at 2 standard deviations will enclose roughly 95% of price data points:
- Select Draw >> Standard Deviation Channel or
 on the toolbar
 - Click and drag over the desired chart segment
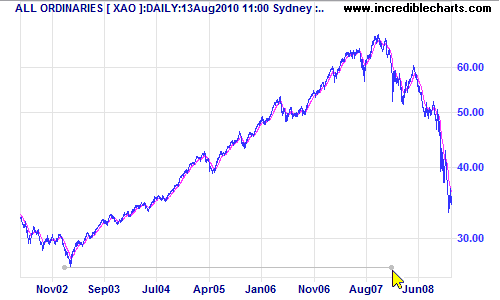
- Enter the number of standard deviations (2.0 recommended) and click Select.
- Select Draw >> Standard Deviation Channel or
- How do I edit or delete a trendline?
- Right-click on the trendline to edit its properties.

- How do I drag a trendline to a new position?
To drag one end of the trendline:
- Place your mouse over the end of the trendline and a square will appear
- Click the anchor at the end of the Trendline and drag to a new position.

To drag a trendline to a completely new position while retaining the existing angle:
- Place your mouse near the middle of the trendline and a hand will appear.
- Click and drag the line to a new position.

- How do I add captions to a chart?
- Select Draw >> Caption or
 on the toolbar
 - Click on the chart to place the Caption.
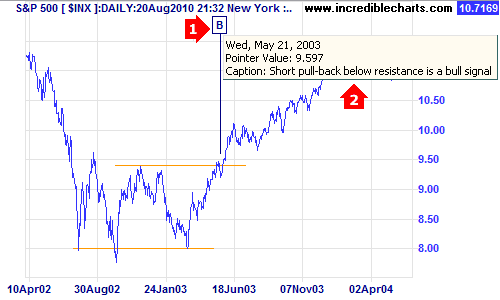
- Add a Caption Marker (1 below) or leave blank if you want the captions to number sequentially
- Add a detailed Caption (2 below) that displays on mouse-over
- Select Draw >> Caption or
- How do I transfer my trendlines, captions and indicators to another computer?
- Copy the User Files folder at C:\Program Files\Incredible Charts on your old computer to a USB memory stick.
- On the new computer use File >> Import Files on the chart menu to retrieve your projects and watchlists from the User Files folder on the USB memory stick.
- My trendlines have disappeared.Trendlines are stored in a .ini project file on your computer. Unless the file has been deleted, they should be available.
- Right-click on the Trendline
 icons on the toolbar. A red check icon
  should display. If not, select
  Show Trendlines.
 - If you have amended the color scheme you may have white captions against a white background. Select Format Charts >> Colors.
- Have you switched from Normal to Log view? Trendlines are unique to the normal/log chart that you draw them on.
- Have you changed chart intervals (Minute/Hour/Daily/Weekly/Monthly)? Trendlines are unique to the chart interval that you draw them on.
- Have you switched projects? Trendlines are unique to each project file.
- Have you deleted the trendlines by mistake? (If you right-click on a chart, there is an option to delete all trendlines/captions). Try the File >> Undo My Changes command.
- Have you recently re-installed Incredible Charts? You may have installed to a new folder. If there are two folders, transfer all .ini and .viz files to the new folder using the File >> Import Files command.
- Right-click on the Trendline
How do I create captions?
- How do I add captions to a chart?
- Select Draw >> Caption or
 on the toolbar
 - Click on the chart to place the Caption.
- Add a Caption Marker (1 below) or leave blank if you want the captions to number sequentially
- Add a detailed Caption (2 below) that displays on mouse-over

- Select Draw >> Caption or
- How do I transfer my trendlines, captions and indicators to another computer?
- Copy the User Files folder at C:\Program Files\Incredible Charts on your old computer to a USB memory stick.
- On the new computer use File >> Import Files on the chart menu to retrieve your projects and watchlists from the User Files folder on the USB memory stick.
How do I set up a watchlist?
- How do I delete stocks from the drop-down list on the toolbar?The drop-down list is not a watchlist. It reflects the last 30 stocks charted. If you do not chart a stock it will soon fall off the list. You cannot delete individual stocks from the list. To clear the entire list, delete the file Securities_ReOpen.list located at C:\Program Files\IncredibleCharts\UserFiles.
Consider using a watchlist, where you can add/delete stocks and scroll through the watchlist from the toolbar. - How do I create a watchlist?
- Select Watchlist >> New Watchlist on the chart menu
- Create a name (for example My Stocks) and click OK.
- How do I add a stock or index to a watchlist?
- Open the stock or index chart
- Select Add Security To Watchlist on the toolbar

- Select your watchlist from the pop-up menu.
- How do I scroll through the stocks in my watchlist?
- Select the required watchlist using Watchlists >> Set Active Watchlist on the chart menu
- Select Scroll Watchlist on the toolbar
- Use the up/down arrows to scroll through the list.

- Is there a shortcut to scroll through watchlists?
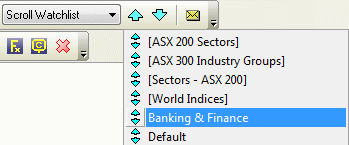
- Select Scroll Watchlist on the toolbar, then right-click the up-arrow
- Select your watchlist (e.g. Banking & Finance) from the menu
- Right-click on the down-arrow to select a specific stock
- Or left-click the up/down arrows to scroll through the list.
- How do I backup my watchlists and projects so that they can be recovered if my computer fails? Copy the User Files folder at C:\Program Files\Incredible Charts to an external disk or USB memory stick.
- How do I transfer projects and watchlists from one computer to another?
- Copy the User Files folder at C:\Program Files\Incredible Charts on your old computer to a USB memory stick.
- On the new computer use File >> Import Files on the chart menu to retrieve project and watchlist files from the memory stick.
- How do I create a large watchlist from an Excel or CSV file?
- How do I print a watchlist?
- Open the watchlist file (e.g. Default.viz) at C:\Program Files\IncredibleCharts\UserFiles with Notepad or Word
- Select File >> Print
How to screen stocks for opportunities
- How do I open the stock screener?
- Select Securities >> Stock Screens on the chart menu; or
- click
 on the toolbar.

- How do I select stocks belonging to an index?
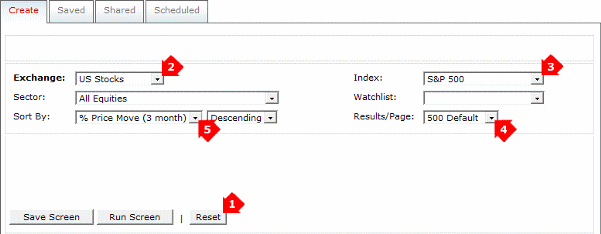
- Click the Reset button to clear any existing filters
- Select an Exchange
- Select an Index (e.g. S&P 500) or Watchlist if required
- Adjust Results/Page if required
- Adjust Sort By order (e.g. % Price Move over 3 months) if required
- Click the Run Screen button.
- How do I filter for trending stocks using a moving average?To filter for stocks that are above their 100-day exponential moving average:
- Select Moving Average (Exponential)
- Choose a fast moving average or Close (for closing price)
- Select Above for a bull signal (select Below for a bear signal)
- Choose a slow moving average (e.g. 100-day)
- Select Within to identify recent cross overs.
- Select the number of trading days to include (All would capture all stocks above the MA)
- Click the Add button, then Run Screen.

- How do I exclude recent moving average crossovers - to identify established trends? To filter for stocks that are above their 100-day exponential moving average:
- Select Moving Average (Exponential)
- Choose a fast moving average or Close (for closing price)
- Select Above for a bull signal (select Below for a bear signal)
- Choose a slow moving average (e.g. 100-day)
- Select Exclude to exclude recent crossovers
- Select the number of trading days to exclude (e.g. 15 days)
- Click the Add button, then Run Screen.
- How do I sort returned stocks from strongest to weakest?
- Click on the EMA header to order from the highest days above the MA to the lowest.
These are strong trending stocks - entry opportunities often present themselves when stocks dip back to the moving average and the 3-month % price move is low.

- Click on the EMA header again to reverse the order.
- Click on the EMA header to order from the highest days above the MA to the lowest.
- How do I view a chart from the stock screen return?
- Double-click on a stock; or
- Right-click and select Chart the Selected Security.
- How do I scroll stocks returned in a stock screen?
- Select Charts on the top menu
- Select Scroll Stockscreen on the toolbar
- Use the up/down arrows on the toolbar, or your keyboard, to scroll through the stock screen
- Right-click the yellow down-arrow if you want to select a specific stock .

- How do I add stocks to an existing watchlist from the stock screener?
- Run the stock screen
- Right click on the list of returned stocks and select Add Selected Security To Watchlist
- Then choose a watchlist.
- How do I create a new watchlist with the results of my stock screen?
- Run the stock screen
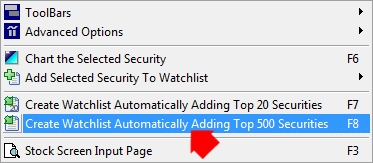
- Right click on the list of returned stocks and select one of the Create Watchlist..... options
- Or use the F8 shortcut key to create a watchlist.
How do I create custom projects?
- What is a project?
A project is a file that contains its own unique:
- indicators;
- trendlines;
- captions; and
- chart format.
Projects do not contain price data which is stored separately.
- Why should I use projects?
Projects enable you to customize charts for specific purposes:
- More than one trading system with separate indicators;
- Separate Minute, Hourly, Daily, Weekly or Monthly studies with their own custom charts; or
- Sectors or industry groups with their own indices.
- How do I select a project?
Incredible Charts always opens with the Default project file. To open another project:
- Select a recently used project from the bar below the charts

- Or select File >> Open Project for a complete menu.
- How do I customize my project chart?
- Open the project and set up your chart (display period, chart interval, log or arithmetic scale and chart type) as you want it to display
- Use the F6 shortcut key or View >> Project Defaults to open the Options window
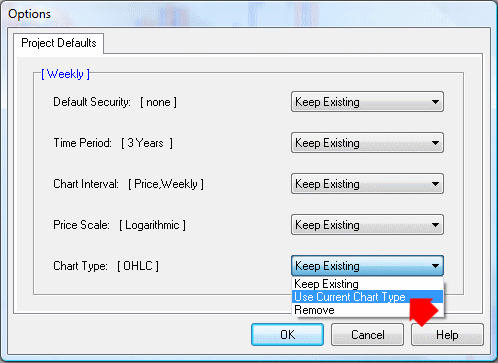
- Leave Default Security unchanged unless the project is intended for a specific stock or index
- Set Time Period, Chart Interval, Price Scale and Chart Type to Use Current...
- Click OK
