Daily, Weekly and Monthly Charts
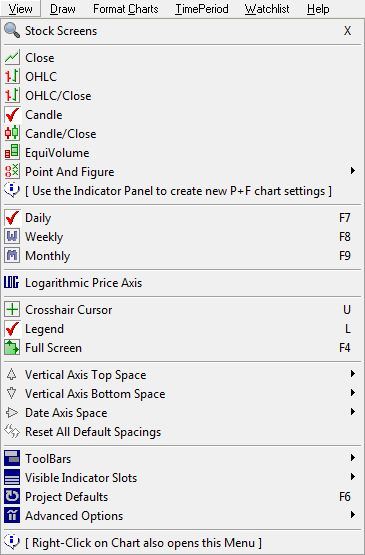
To change time frames within a project, use View on the main menu. Three time frames are available: Daily, Weekly or Monthly bars.

Alternatively, you can use the F7, F8 and F9 shortcut keys or the drop-down menus on the toolbar:

Setting Indicators
The Daily, Weekly and Monthly charts are not integrated: you can set separate indicators (Moving Averages or Bollinger Bands for example) on each of the charts. You can also set daily indicators on monthly charts and vice versa. Indicator settings do not automatically change as you switch from Daily to Weekly to Monthly charts.
Setting Indicators on the Price Chart
Some indicators (for example: Moving Averages and Bollinger Bands) are plotted on the main price chart. These have to be set on the required Daily, Weekly or Monthly chart.
To set an indicator on the Daily price chart:
- Open the Daily chart (If a Weekly chart open, the indicator will be added to the Weekly price chart)
- Open the Indicator Panel
- Select the required indicator
- Adjust the settings to suit the Daily time frame and then select
 to add & save.
Creating Separate Daily, Weekly and Monthly Indicator Views
There are two ways for you to set up indicators for Daily, Weekly and Monthly time frames:
- Set up all indicators in a single Project File.
This is a convenient way to view each indicator as a full-screen chart, in a split-screen view with the price chart, or view all indicators in panels below the price chart. The disadvantage is that each indicator must be viewed separately - 2 or more indicators cannot be viewed at the same time.- Open the Indicator Panel.
- Select an indicator and adjust the settings to your Daily requirements before saving
 .
. - Repeat the above step but with Weekly and then Monthly settings.
OR
- Set up separate project Files for Daily, Weekly and Monthly views.
This is less convenient than method 1. but allows you to view 2 or more relevant indicators at the same time.- Using File >> New Project, create a separate Weekly and Monthly file.
- Open the Weekly file and set up Weekly Indicators as in 1. above.
- Open the Monthly file and set up Monthly indicators.
Default, Weekly and Monthly Projects
Use the Default, Weekly and Monthly projects on the bottom project bar. This enables you to set up separate indicator studies and default views (using the F6 shortcut key) for each time frame.
Next: Projects Explained
