Getting Started: Trendlines & Captions
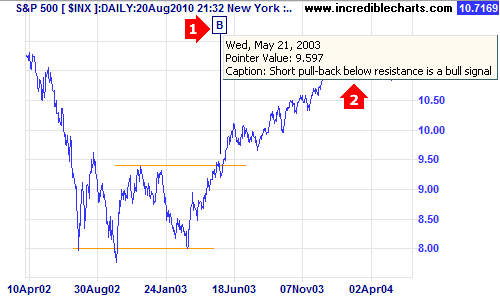
Add a Caption
- Select Draw >> Caption or
 on the toolbar
 - Click on the chart to place the Caption.
- Add a Caption Marker (1 below) or leave blank if you want the captions to number sequentially
- Add a detailed Caption (2 below) that displays on mouse-over

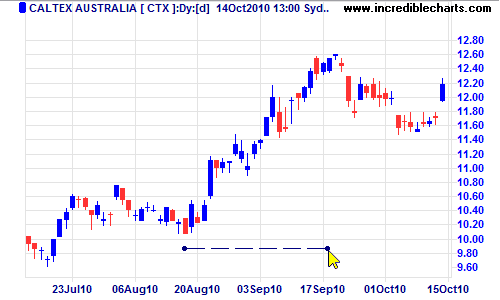
Draw a Trendline
To draw a trendline:
- Select Draw >> Autofit Trendline or
 on the toolbar
 - Drag your mouse below (up-trend) or above (down-trend) the price bars for the period
- Select Closing Price for long-term charts or Highs/Lows for short-term (less than 6 months)
- The trendline will automatically fit to price bars in the selected time period

To modify a trendline:
- Right-click on the trendline to edit its properties.
- Click on the trendline to drag it to a new position.
- Click on the anchor at either end to drag that end only.

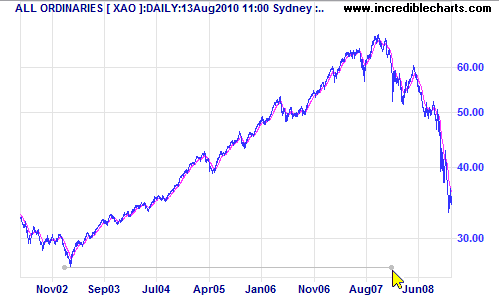
Draw a Standard Deviation Channel
This fits a linear regression line to selected data, with channel lines normally at 2 standard deviations on either side (enclosing roughly 95% of the data).
- Select Draw >> Standard Deviation Channel or
 on the toolbar
 - Click on the chart and drag across the selected time period

- Select the number of standard deviations (normally 2.0)

