Point and Figure Setup
Point and Figure Charts
Point and Figure charts are used to identify support levels, resistance levels and chart patterns. Point & Figure ignores the time factor and concentrates solely on movements in price: a column of X’s or O’s may take one day or several weeks to complete.

View Point & Figure Charts
To view Point and Figure charts:
- Click
 on the toolbar; or
 - Click View >> Line / Bar Types >> Point And Figure on the main menu.
Select Point & Figure Chart Styles
The default Point & Figure setting is:
- Box size of 1;
- Reversal amount of 3; and
- High/Low price option.
If you set up other Point & Figure styles, you can select these from:
- the drop-down box next to the Point & Figure icon
 or
or - View >> Line / Bar Types >> Point & Figure on the main menu.
Create Your Own Point & Figure Chart Styles
- Open the Indicator Panel - Select Indicators on the main menu
- Select Point and Figure in the left column of the Indicator Panel
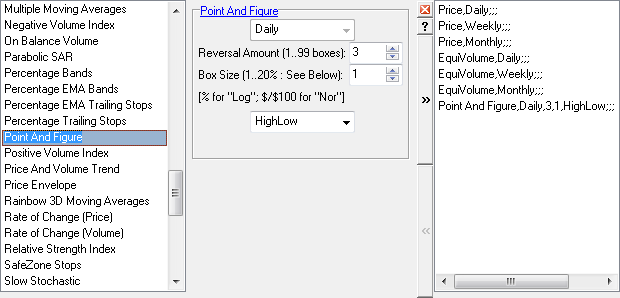
- Adjust the Reversal amount in the center of the Indicator Panel
- Adjust the Box size
- Select a price option: High/Low, Closing Price or Typical Price
- Save your selection
 in the right column
 - Close
 the Indicator Panel
 - Select Logarithmic
 scale On/Off on the toolbar or under View on the main menu.