Aroon Oscillator
The Aroon Oscillator was developed by Tushar Chande to highlight the start of a new trend and to measure trend strength. Chande first described the indicator in the September 1995 issue of Stocks & Commodities magazine. The Aroon indicator system consists of three lines: Aroon Up, Aroon Down, and the Aroon Oscillator which reflects the difference between the two. "Aroon" is a Sanskrit word meaning "dawn's early light".
Aroon Trading Signals
The Aroon Up and Aroon Down indicators signal the start of a new trend. Chande recommends the following signals:
- Aroon Up above 70 indicates a strong up-trend.
- Aroon Down above 70 indicates a strong down-trend.
- Aroon Up below 50 warns that the up-trend is weakening.
- Aroon Down below 50 signals that the down-trend is weakening.
- The two moving lower in close proximity indicates consolidation, with no clear trend.
Trading signals for the Aroon Oscillator:
- Above zero signals an up-trend.
- Below zero indicates a down-trend.
- The farther away Aroon Oscillator is from the zero line, the stronger the trend.
Example
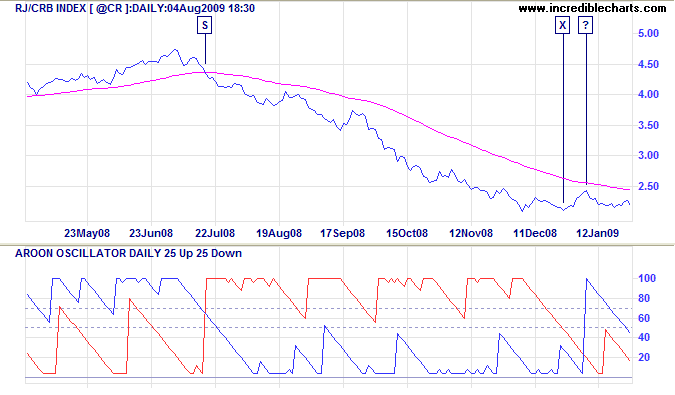
The CRB Commodities index is shown with Aroon Up and Aroon Down. The 63-Day Exponential Moving Average is used as a filter: only take long signals above the moving average and only take short signals below.

Mouse over chart captions to display trading signals.
- Go short [S] when Aroon Down [red] crosses to above 70 and price is below the 63-Day moving average.
- Exit [X] when Aroon Down retreats below 50.
- Do not go long at [?] because price is below the 63-Day moving average.

Mouse over chart captions to display trading signals.
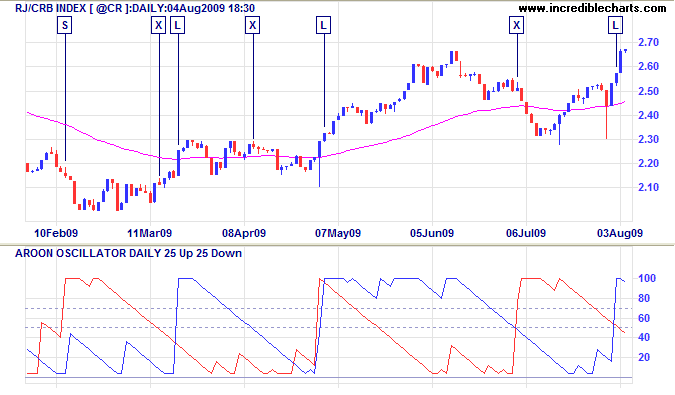
The next few months are shown in greater detail.
- Go short [S] when Aroon Down [red] crosses to above 70 and price is below the 63-Day moving average.
- Exit [X] when Aroon Down retreats below 50.
- Go long [L] when Aroon Up [blue] crosses above 70 and price is above the 63-Day moving average.
- Exit [X] when Aroon Up retreats below 50.
- Do not go short when Aroon Down crosses above 70 because price is above the 63-Day moving average.
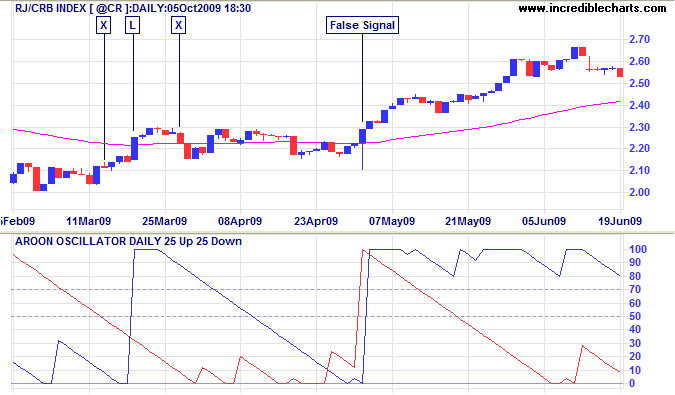
Go Long [L] the next day when Aroon Up [blue] crosses above 70 and above Aroon Down. - Exit [X] when Aroon Up retreats below 50.
If Aroon Up had to cross below Aroon Down while above 50, this would also signal an exit. - Do not go short when Aroon Down crosses above 70 because price is above the 63-Day moving average. This trade is stopped out when price reverses above the moving average 9 days later.
- Go long [L] when Aroon Up crosses above 70 and price is above the 63-Day moving average.
Setup
The default time period for the Aroon indicators is 25 Days.
See Indicator Panel for directions on how to set up an indicator — and Edit Indicator Settings to change the settings.
Aroon Formula
- Determine the time period ("n")
- Count back the number of days from the end of the period to the highest high for the period ("HH")
- Calculate Aroon Up using the formula [( n - HH )/ n ] x 100%
For example, if the period is 25 days and the highest high is today (HH=0), Aroon Up = (25-0)/25 x 100% = 100%. If the highest high occurred 10 days ago (HH=10), then the current value would be (25-10)/25 x 100% = 60%.
- Count back the number of days from the end of the period to the lowest low for the period ("LL")
- Calculate Aroon Down using the formula [( n - LL )/ n ] x 100%
Now that we have Aroon Up and Aroon Down we can calculate the Aroon Oscillator:
- Subtract Aroon Down from Aroon Up.
Aroon Evaluation
A weakness was highlighted in the earlier example when price made a false breakout. The chart below shows the false signal. Aroon Down rises to 100% when a long tail makes a new 25-day low. Aroon Down highlights the low, but the strong close is a bull signal, indicating buying support.

Mouse over chart captions to display trading signals.
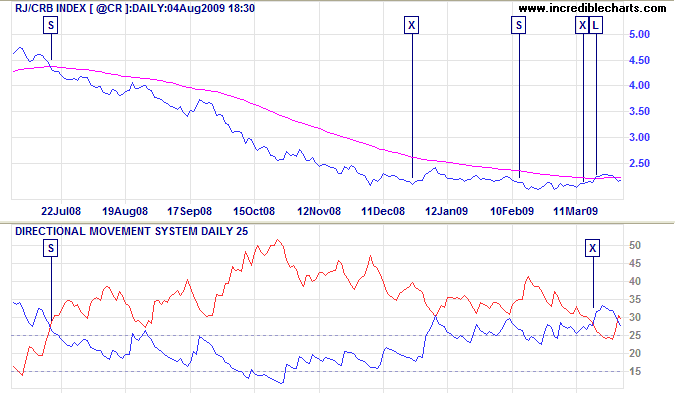
I am impressed, however, with the responsiveness of Aroon Up and Aroon Down. Results are comparable to the acclaimed Directional Movement System when set for a similar period.
The CRB index chart below shows signals from the Aroon system (and 63-Day exponential moving average) on the price chart — and Directional Movement (25-Day) below. The shorter-period 14-Day Directional Movement System was discarded as it gave too many false signals. Responsiveness of the two indicators is similar, with identical entry points at [S]. Directional Movement keeps you in the trend longer, but perhaps too long in this case. Performance of either system is enhanced by use of the long-term moving average as a filter.

Mouse over chart captions to display trading signals.
While impressed with Aroon Up and Aroon Down, I do not find the actual Aroon Oscillator particularly useful as a measure of trend strength.

Author: Colin Twiggs is a former investment banker with almost 40 years of experience in financial markets. He co-founded Incredible Charts and writes the popular Trading Diary and Patient Investor newsletters.
Using a top-down approach, Colin identifies key macro trends in the global economy before evaluating selected opportunities using a combination of fundamental and technical analysis.
Focusing on interest rates and financial market liquidity as primary drivers of the economic cycle, he warned of the 2008/2009 and 2020 bear markets well ahead of actual events.
He founded PVT Capital (AFSL No. 546090) in May 2023, which offers investment strategy and advice to wholesale clients.
