Bollinger Band Width Indicator
Bollinger Band Width is described by John Bollinger on his website. It reflects the width of Bollinger Bands on the price chart.
Bollinger Band Width Trading Signals
Bollinger's Bandwith Indicator is used to warn of changes in volatility. As we know from using Bollinger Bands, a squeeze where the bands converge into a narrow neck often precedes a rapid rise in volatility. A Bollinger Band squeeze is highlighted by a fall in the Band Width indicator to below 2.0%. Bollinger claims that a drop below 2% on the S&P 500 has led to many spectacular moves, but warns that the market often starts with a fake move, in the wrong direction, before the real move commences.
Example
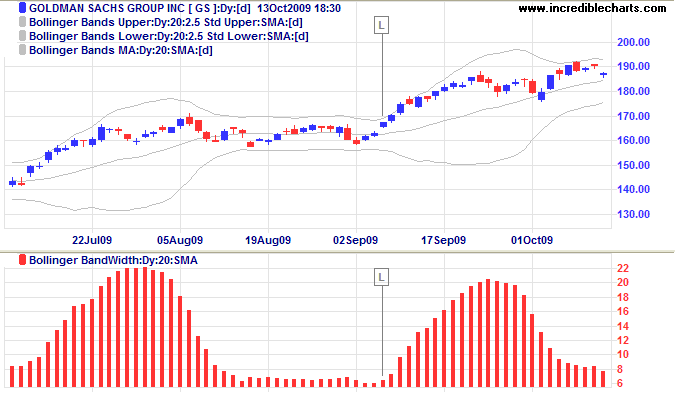
Goldman Sachs is displayed with 20-day Bollinger Band Width.

Mouse over chart captions to display trading signals.
- Go long [L] when Bollinger Band Width starts to rise after contracting to a historic low.
Bollinger requires contractions below 2.0%, but wider contractions provide perfectly adequate signals.
Setup
The default setting for Band Width is a 20-Day simple moving average with bands drawn at 2 standard deviations.
See Indicator Panel for directions on how to set up an indicator — and Edit Indicator Settings to change the settings.
Bollinger Band Width Formula
Bollinger Band Width = (Upper Band - Lower Band) / Simple Moving Average for the same period

Author: Colin Twiggs is a former investment banker with almost 40 years of experience in financial markets. He co-founded Incredible Charts and writes the popular Trading Diary and Patient Investor newsletters.
Using a top-down approach, Colin identifies key macro trends in the global economy before evaluating selected opportunities using a combination of fundamental and technical analysis.
Focusing on interest rates and financial market liquidity as primary drivers of the economic cycle, he warned of the 2008/2009 and 2020 bear markets well ahead of actual events.
He founded PVT Capital (AFSL No. 546090) in May 2023, which offers investment strategy and advice to wholesale clients.
