Choppiness Index
The Choppiness Index is a volatility indicator developed by Australian commodity trader Bill Dreiss to indicate whether a market is trending or ranging. Values range between 0 and 100, with low values indicating a strong trend and high values signaling consolidation.
Choppiness Index Trading Signals
Traders often use Fibonacci values as thresholds for trending and ranging markets:
- Choppiness Index values below 38.2 indicate a trend; and
- Values above 61.8 signal consolidation.
The Choppiness Index does not predict future direction, it is simply a measure of current trend status.
Example
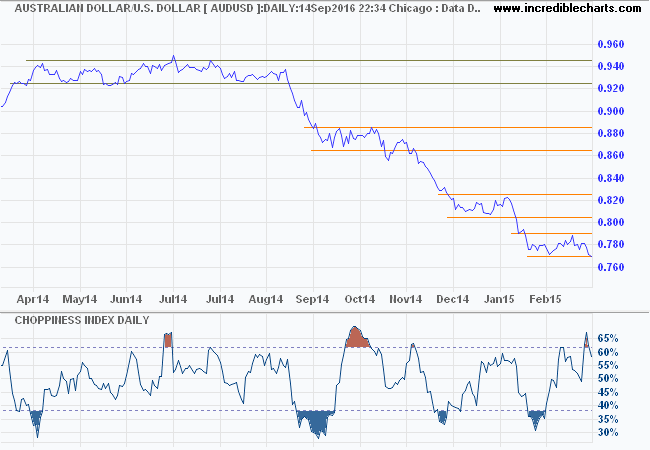
A daily chart of the Australian Dollar/US Dollar (AUDUSD) is plotted with 14-day Choppiness Index.

While the Choppiness Index does highlight the broad consolidation in 2014, oscillating above the 38.2 trend threshold for several months, crosses below 38.2 [marked in blue] often lag the actual trend. I think one could do better from a visual inspection of the chart.
Setup
The default setup is 14 days.
Select Indicators and Choppiness Index in the left column of the Indicator Panel. See Indicator Panel for directions on how to set up an indicator. To alter the default settings - Edit Indicator Settings.
Colors
To amend indicator colors, open the legend by clicking "L" on the toolbar or typing "L" on your keyboard. Adjust individual colors by clicking on the color patches next to the indicator in the legend.
Choppiness Index Formula
- Sum True Range for the past n periods.
- Divide by the result of the following two steps:
- Calculate the lowest TrueLow for n periods.
- Subtract from the highest TrueHigh for n periods.
- Calculate Log10 of the result then Multiply by 100.
- Divide the result by Log10 of n.
Mathematical Notation
Choppiness Index = 100 * Log10 { Sum(TrueRange,n) / [ Maximum(TrueHigh,n) - Minimum(TrueLow,n) ] } / Log10(n)

Author: Colin Twiggs is a former investment banker with almost 40 years of experience in financial markets. He co-founded Incredible Charts and writes the popular Trading Diary and Patient Investor newsletters.
Using a top-down approach, Colin identifies key macro trends in the global economy before evaluating selected opportunities using a combination of fundamental and technical analysis.
Focusing on interest rates and financial market liquidity as primary drivers of the economic cycle, he warned of the 2008/2009 and 2020 bear markets well ahead of actual events.
He founded PVT Capital (AFSL No. 546090) in May 2023, which offers investment strategy and advice to wholesale clients.
