Heikin Ashi Candlesticks
Heikin Ashi candlesticks filter out market noise from the traditional Japanese candlestick chart and highlight trend and/or consolidation patterns.
Heikin Ashi Candlestick Formula
Heikin-Ashi Candlesticks are calculated using smoothed values for Open, High, Low and Close:
- Heikin-Ashi Close is the average of Open, High, Low and Closing Price for the period.
- Heikin-Ashi Open is the average of the Heikin Ashi Open and Close for the previous candle.
- Heikin-Ashi High is the highest of three points for the current period:
- The High
- Heikin-Ashi Open
- Heikin-Ashi Close
- Heikin-Ashi Low is the lowest of three points for the current period:
- The Low
- Heikin-Ashi Open
- Heikin-Ashi Close
Heikin Ashi Trading Signals
Signals should be interpreted in the same way as on traditional candlestick charts. Long candles indicate a strong trend, while doji candles (and spinning tops) indicate consolidation that may warn of a reversal.
Long Lines

The long white line is a sign that buyers are firmly in
control - a bullish candlestick.
A long black line shows that sellers are in
control - definitely bearish.
Marubozu Candlesticks

Marubozu are even stronger bull or bear signals than long lines as they show that buyers/sellers have remained in control from the open to the close — there are no intra-day retracements.
Doji Candlesticks

The doji candlestick occurs when the open and closing price are equal.
An open and close in the middle of the candlestick signal indecision. Long-legged dojis, when they occur after small candlesticks, indicate a surge in volatility and warn of a potential trend change. 4 Price dojis, where the high and low are equal, are normally only seen on thinly traded stocks.
Heikin Ashi Compared to Traditional Candlesticks
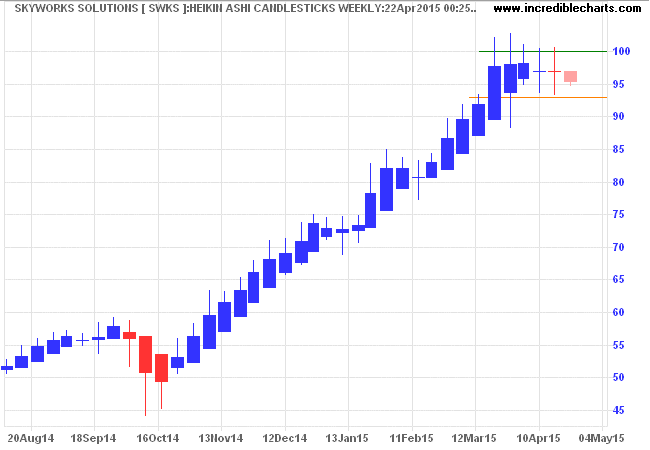
Skyworks Solutions (SWKS) Pivot Point is first plotted with weekly Heikin-Ashi candlesticks.
And then with traditional Japanese candlesticks (weekly).
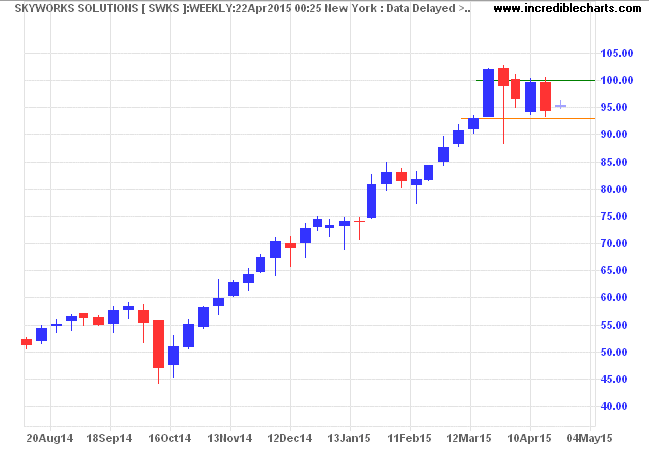
Heikin-Ashi candlesticks give a clearer depiction of the trend from late October 2014 and also of resistance at the $100 mark. Narrow consolidation below resistance is a bullish sign.
Setup
- Select
Indicators in the chart menu. - Select Heikin-Ashi Candlesticks in the left column of the Indicator Panel.
- Select Daily or Weekly candles.
- Save indicator to the right column [>>].
See Indicator Panel for further directions.

Author: Colin Twiggs is a former investment banker with almost 40 years of experience in financial markets. He co-founded Incredible Charts and writes the popular Trading Diary and Patient Investor newsletters.
Using a top-down approach, Colin identifies key macro trends in the global economy before evaluating selected opportunities using a combination of fundamental and technical analysis.
Focusing on interest rates and financial market liquidity as primary drivers of the economic cycle, he warned of the 2008/2009 and 2020 bear markets well ahead of actual events.
He founded PVT Capital (AFSL No. 546090) in May 2023, which offers investment strategy and advice to wholesale clients.