Keltner Channels (also known as "Keltner Bands")
Chester Keltner, in his 1960 book How to Make Money in Commodities, plotted channels as a multiple of daily range (high - low) around a moving average of Typical Price. Linda Bradford Raschke popularized a simplified version, using exponential smoothing and Average True Range, that is now more widely used.
Keltner originally devised the channels for use as a trend-following system, but they may also be used to trade ranging markets, in a similar fashion to Bollinger Bands or Price Envelopes.
Keltner Trading Signals
First, identify whether price is trending or ranging.
Ranging Market
The theory is that a movement that starts at one price band is likely to carry to the other.
- Go long when prices turn up at or below the lower band. Close your position if price turns down near the upper band or crosses to below the moving average.
- Go short when price turns down at or above the upper band. Close your position if price turns up near the lower band or crosses to above the moving average.
Place stop losses below the most recent low when you go long or above the latest high when short.
Use reversal signals to identify turning points close to the upper and lower bands.
Trending Market
Keltner believed that a close above the upper band, or below the lower band, is evidence of a strong move and should be traded as a breakout.
- Go long when price breaks above the upper band. Set a stop loss below the moving average and exit if price crosses below the moving average.
- Go short when price turns below the lower band. Set a stop loss above the moving average and exit if price crosses above the moving average.
Keltner originally used the lower and upper bands for exits, but these tend to be late.
Example
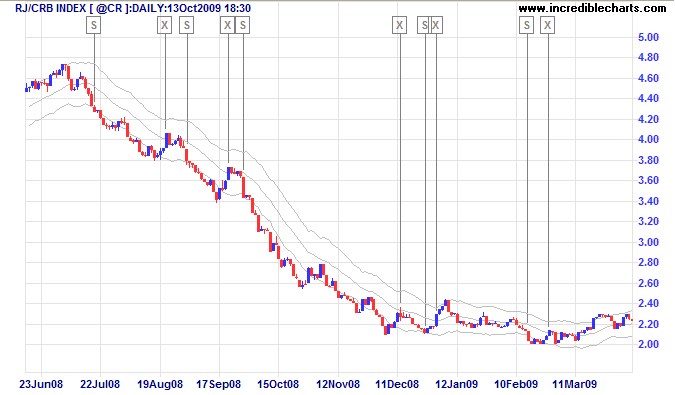
The RJ CRB Commodities Index down-trend is displayed with the modified version of Keltner Channels with 20-day exponential moving average, 10-day ATR and Keltner bands set at 2.5 times average true range.

Mouse over chart captions to display trading signals.
- Go short [S] when price closes below the lower channel
- Exit [X] when price crosses above the moving average
Example 2
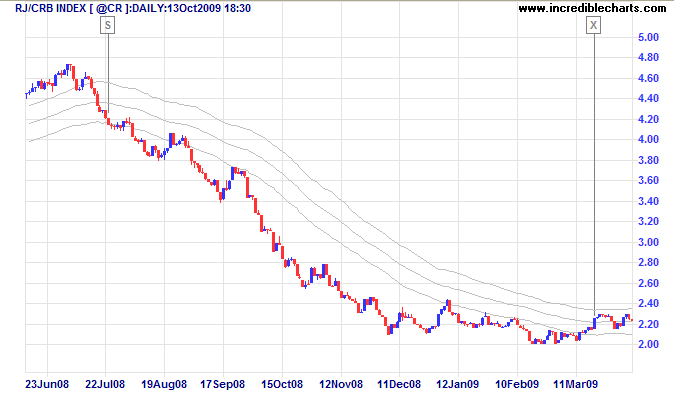
Long-term traders may prefer to use longer moving average and ATR settings. Here is the same chart, but with 63-day exponential moving average, 21-day ATR and Keltner bands at 2.5 times average true range.

Mouse over chart captions to display trading signals.
- Go short [S] when price closes below the lower channel
- Exit [X] when price crosses above the moving average
ATR Channel Breakout
Curtis Faith in his book Way Of The Turtle describes a variation of the Keltner system used by the legendary Turtle Traders. The channel is based on a 350-Day (exponential) moving average of closing prices, with the upper border plotted as 7 times 350-Day ATR and the lower border as 3 times ATR.
- Go long at the open if the previous day closes above the upper band.
- Go short at the open if the previous day closes below the lower band.
- Exit when price crosses back through the moving average.
Accelerating Trends
Linda Raschke maintains that Keltner Bands are of greatest value in determining runaway market conditions, often referred to as accelerating trends or blowoffs, when retracements are likely to be extremely short or non-existent. Keltner Bands alert traders that normal trading techniques, such as buying on dips, should be adjusted to fit the changed circumstances.
Setup
Incredible Charts provides two versions of Keltner Channels:
- Keltner Channels (Original), using Keltner's first published settings: a 10-day simple moving average of Typical Price and 10-day average daily range (high - low) with a multiple of 1; and
- Keltner Channels, the more popular version from Linda Raschke: a 20-day exponential moving average of Closing Price and a multiple of 2.5 times 20-day Average True Range.
Separate multiples of ATR can be plotted for the upper and lower bands.
See Indicator Panel for directions on how to set up an indicator — and Edit Indicator Settings to change the settings.
Keltner Channel Formula
The original formula used a simple moving average of Typical Price, (High + Low + Close) / 3, but Linda Raschke's version dispensed with Typical Price, as the exponential moving average provides sufficient smoothing on its own. Here is the formula for the later, simplified version:
Upper Band = Exponential MA of Closing Price + multiple of Average True Range
Lower Band = Exponential MA of Closing Price - multiple of Average True Range
Keltner Evaluation
Keltner Channels are a useful enhancement for eliminating whipsaws when trading trends with a moving average system.

Author: Colin Twiggs is a former investment banker with almost 40 years of experience in financial markets. He co-founded Incredible Charts and writes the popular Trading Diary and Patient Investor newsletters.
Using a top-down approach, Colin identifies key macro trends in the global economy before evaluating selected opportunities using a combination of fundamental and technical analysis.
Focusing on interest rates and financial market liquidity as primary drivers of the economic cycle, he warned of the 2008/2009 and 2020 bear markets well ahead of actual events.
He founded PVT Capital (AFSL No. 546090) in May 2023, which offers investment strategy and advice to wholesale clients.
