Linear Regression Indicator
The Linear Regression Indicator is used for trend identification and trend following in a similar fashion to moving averages. The indicator should not be confused with Linear Regression Lines — which are straight lines fitted to a series of data points. The Linear Regression Indicator plots the end points of a whole series of linear regression lines drawn on consecutive days. The advantage of the Linear Regression Indicator over a normal moving average is that it has less lag than the moving average, responding quicker to changes in direction. The downside is that it is more prone to whipsaws.
Linear Regression Trading Signals
The Linear Regression Indicator is only suitable for trading strong trends. Signals are taken in a similar fashion to moving averages. Use the direction of the Linear Regression Indicator to enter and exit trades — with a longer term indicator as a filter.
- Go long if the Linear Regression Indicator turns up — or exit a short trade.
- Go short (or exit a long trade) if the Linear Regression Indicator turns down.
A variation on the above is to enter trades when price crosses the Linear Regression Indicator, but still exit when the Linear Regression Indicator turns down.
Example
Goldman Sachs is displayed with 100-day Linear Regression Indicator and 300-day Linear Regression Indicator employed as a trend filter.
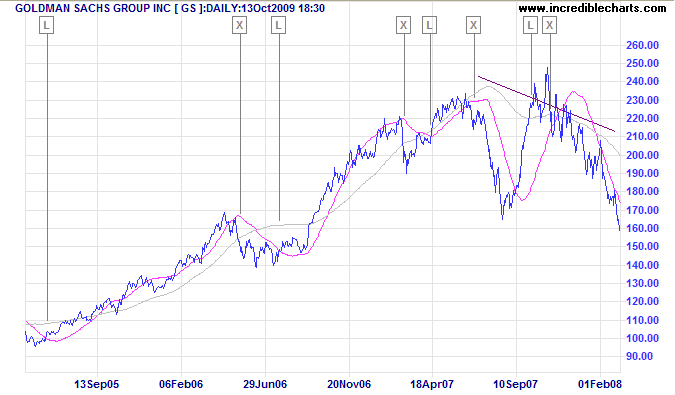
Mouse over chart captions to display trading signals.
- Go long [L] when price crosses above the 100-day Linear Regression Indicator while the 300-day is rising
- Exit [X] when the 100-day Linear Regression Indicator turns down
- Go long again at [L] when price crosses above the 100-day Linear Regression Indicator
- Exit [X] when the 100-day Linear Regression Indicator turns down
- Go long [L] when price crosses above 100-day Linear Regression
- Exit [X] when the 100-day indicator turns down
- Go long [L] when the 300-day Linear Regression Indicator turns up after price crossed above the 100-day Indicator
- Exit [X] when the 300-day Linear Regression Indicator turns down. Bearish divergence on the indicator warns of a major trend reversal.
Setup
Setup for the Linear Regression Indicator is simple. The default time period is 63 days. This can be varied between 14 days and 300 days depending on the wave-length of the trend you are tracking.
See Indicator Panel for directions on how to set up an indicator.
Linear Regression Indicator Formula
The formula uses the sum of least squares method to find a straight line that best fits data for the selected period. The end point of the line is plotted and the process repeated on each succeeding day.

Author: Colin Twiggs is a former investment banker with almost 40 years of experience in financial markets. He co-founded Incredible Charts and writes the popular Trading Diary and Patient Investor newsletters.
Using a top-down approach, Colin identifies key macro trends in the global economy before evaluating selected opportunities using a combination of fundamental and technical analysis.
Focusing on interest rates and financial market liquidity as primary drivers of the economic cycle, he warned of the 2008/2009 and 2020 bear markets well ahead of actual events.
He founded PVT Capital (AFSL No. 546090) in May 2023, which offers investment strategy and advice to wholesale clients.