Money Flow Index
The Money Flow Index is a volume-weighted version of the Relative Strength Index, used to warn of trend weakness and likely reversal points. The indicator compares the value traded on up-days to value traded on down-days.
Trading Signals
Ranging Market
Ranging markets can be identified by Money Flow Index fluctuating close to the 50 level.
Trending Market
Market tops are likely when a medium term Money Flow Index is above 80.
Market bottoms are likely when a medium term Money Flow Index is below 20.
- Go long on bullish divergence.
- Go short on bearish divergence.
Only trade with the trend and exit using a trend indicator.
Example
Microsoft Corporation plotted with Bollinger bands at 2.0 standard deviations around a 20 day exponential moving average and 20 day Money Flow Index.
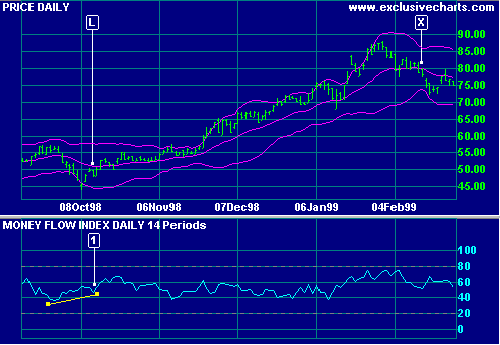
Mouse over chart captions to display trading signals.
Exit using the moving average - this example uses MA direction as a filter. Compare this to the results if a single close or 2 closes are used as a filter.
- Go long [L] on a bullish divergence. Exit when the moving average turns down at [X].
Setup
The default Money Flow Index window is 14 days. Overbought/oversold are set at 80% and 20% levels. To alter the default settings - Edit Indicator Settings.
See Indicator Panel for directions on how to set up an indicator.
Formula
- Calculate Typical Price for each period:
(High + Low + Close) / 3 - Calculate Money Flow for each period:
Typical Price * Volume - Decide on the time
frame over which to calculate the index. This should be based on the
cycle that you are trading.
- Calculate Positive Money Flow:
Add Money Flow for each period (in the time frame) that Typical Price moves up. - Calculate Negative Money Flow:
Add Money Flow for each period (in the time frame) that Typical Price moves down. - Calculate the Money Ratio:
Positive Money Flow / Negative Money Flow - Calculate the Money Flow Index:
100 - 100 / (1+ Money Ratio)

Author: Colin Twiggs is a former investment banker with almost 40 years of experience in financial markets. He co-founded Incredible Charts and writes the popular Trading Diary and Patient Investor newsletters.
Using a top-down approach, Colin identifies key macro trends in the global economy before evaluating selected opportunities using a combination of fundamental and technical analysis.
Focusing on interest rates and financial market liquidity as primary drivers of the economic cycle, he warned of the 2008/2009 and 2020 bear markets well ahead of actual events.
He founded PVT Capital (AFSL No. 546090) in May 2023, which offers investment strategy and advice to wholesale clients.