Multiple Moving Averages (MMA)
The Multiple Moving Average indicator was devised by Daryl Guppy and consists of six short-term and six long-term exponential moving averages. The short-term MA's are 3, 5, 7, 10, 12 and 15 days and the long-term MA's are 30, 35, 40, 45, 50 and 60 days but these can be varied according to the Time Frame being traded. The short-term group represent traders' view of the market and the long-term group represent investors.
Trading Signals
Convergence and Divergence:
- When moving averages within a group are parallel and close together, the group are largely in agreement;
- When the moving averages widen, this signals divergent views within the group;
- When moving averages converge, this is a sign that the group view is changing.
Trend strength:
- Parallel long-term MAs signal long-term investor support and a strong trend; and
- Short-term MAs tend to bounce off the long-term moving average group.
Trend weakness:
- Both groups of MAs converge and fluctuate more than usual.
Trend start:
- A change in price direction accompanied by expanding MAs in both groups.
Short-term reversals:
- The short-term group diverge after crossing over before again converging.
Crossovers are not as important as spacing between the MAs in each group.
Example
Apple [AAPL] is displayed with multiple moving averages.
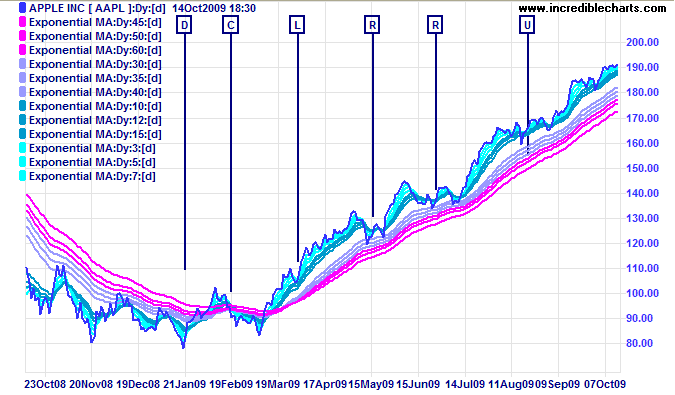
Mouse over chart captions to display trading signals.
- Widely-spaced down-sloping long-term moving averages [D] signal a strong down-trend
- Converging long-term moving averages [C] indicate uncertainty
- Go long [L] when long-term moving averages cross over, with the longest at the bottom
- Retracements [R] that do not disturb the long-term moving averages spacing present opportunities to increase your long position
- Widely-spaced up-sloping long-term moving averages [U] signal a strong up-trend.
Setup
Select Multiple Moving Averages in the left column of the Indicator Panel. Adjust the settings as required and save using the [>>] button.

Author: Colin Twiggs is a former investment banker with almost 40 years of experience in financial markets. He co-founded Incredible Charts and writes the popular Trading Diary and Patient Investor newsletters.
Using a top-down approach, Colin identifies key macro trends in the global economy before evaluating selected opportunities using a combination of fundamental and technical analysis.
Focusing on interest rates and financial market liquidity as primary drivers of the economic cycle, he warned of the 2008/2009 and 2020 bear markets well ahead of actual events.
He founded PVT Capital (AFSL No. 546090) in May 2023, which offers investment strategy and advice to wholesale clients.