Positive Volume Index
The Positive Volume Index was introduced (in Stock Market Logic) by Norman Fosback and is often used in conjunction with Negative Volume Index to identify bull and bear markets.
Positive Volume Index is based on the assumption that the uninformed crowd dominates trading on active days. Negative Volume Index assumes that the smart money dominates trading on quiet days.
Positive Volume Index highlights days when volume is up on the previous day. Negative Volume Index highlights days when volume is down.
Positive Volume Index Trading Signals
Fosback maintains that there is a 67% probability of a bear market when Positive Volume Index is below its 1 year moving average. The probability drops to 21% when PVI is above the moving average.
- Positive Volume Index crossing to below its one year moving average confirms the approach of a bear market.
Example
Procter & Gamble with Positive Volume Index 9-day exponential moving average (fast MA) and 255-day exponential moving average (slow MA).
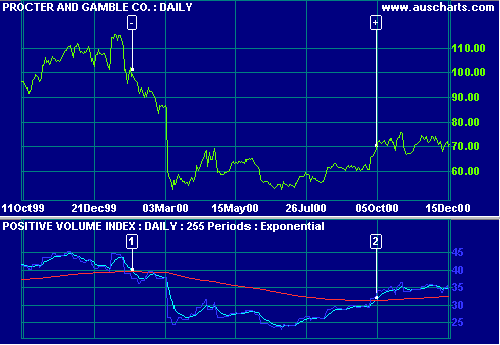
Mouse over chart captions to display trading signals.
- Fast MA crosses to below the slow MA. Bear signal [-].
- Fast MA crosses back to above the slow MA. End of bear signal [+].
Indicator smoothing (the fast MA) eliminates several whipsaws from the Positive Volume Index.
Setup
The default setting for the exponential moving average is 255 days. To alter the default settings - Edit Indicator Settings.
See Indicator Panel for directions on how to set up indicators.
Positive Volume Index Formula
- Take yesterday's Positive Volume Index
- If today's volume is greater than yesterday, add:
{ ( Close [today] - Close [yesterday] ) / Close [yesterday] } * PVI [yesterday] - Otherwise, add zero.

Author: Colin Twiggs is a former investment banker with almost 40 years of experience in financial markets. He co-founded Incredible Charts and writes the popular Trading Diary and Patient Investor newsletters.
Using a top-down approach, Colin identifies key macro trends in the global economy before evaluating selected opportunities using a combination of fundamental and technical analysis.
Focusing on interest rates and financial market liquidity as primary drivers of the economic cycle, he warned of the 2008/2009 and 2020 bear markets well ahead of actual events.
He founded PVT Capital (AFSL No. 546090) in May 2023, which offers investment strategy and advice to wholesale clients.