Price Differential Indicator
Price Differential (or yield differential) is used to compare bond yields or interest rates, which share the same price axis, by merely subtracting the one rate/yield from another.
Example
The yield differential between 10-year Treasury notes and 13-week Treasury bills indicates the shape of the yield curve:
- A negative differential is a bearish signal and is usually followed by economic recession about 12 months later.
- A high positive reading is a bullish signal for investors.
The chart below shows the yield on 10-year US Treasury notes and the Dow Jones Industrial Average in the background. The differential between 10-year US Treasury notes and 13-week US Treasury bills is plotted as an indicator.
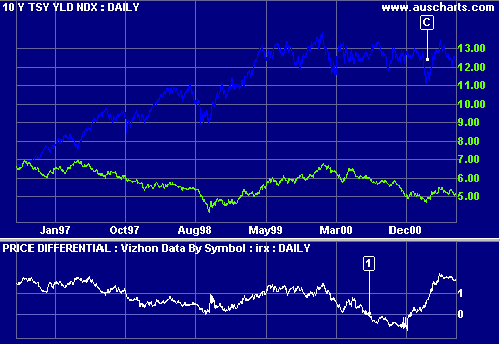
Mouse over chart captions to display trading signals.
- In 2001 the yield differential crosses below zero, signaling a negative yield curve. The Dow Industrial Average undergoes a sharp correction at [C], 8 months later.
Setup
Example: To set up the above Treasury note yield differential.
- Open CBOE 10 Year Yield (TNX) under Indexes: CBOE on the Securities menu
- Select the
 Indicator Panel
 - Select Price Differential in the left column.
A pop-up menu appears of all listed securities exchanges. - Browse the drop-down menu and select CBOE 13 Week Yield (IRX) under Indexes: CBOE
- Select Daily, Weekly or Monthly from the center panel
- Select Apply to Project or Apply to Securityfrom the
center panel.
Apply to Project applies the the indicator to all securities in the current project.
Apply to Security applies the the indicator to the current security only. - Save the settings using >.
- Close the indicator panel using X.

Author: Colin Twiggs is a former investment banker with almost 40 years of experience in financial markets. He co-founded Incredible Charts and writes the popular Trading Diary and Patient Investor newsletters.
Using a top-down approach, Colin identifies key macro trends in the global economy before evaluating selected opportunities using a combination of fundamental and technical analysis.
Focusing on interest rates and financial market liquidity as primary drivers of the economic cycle, he warned of the 2008/2009 and 2020 bear markets well ahead of actual events.
He founded PVT Capital (AFSL No. 546090) in May 2023, which offers investment strategy and advice to wholesale clients.