Rate of Change (Volume)
Rate of Change Volume (ROCV) is an oscillator applied to volume rather than price and is calculated in the same manner as the Rate of Change (Price) indicator.
ROCV highlights increases in volume, which normally occur at most significant market tops, bottoms and breakouts.
Trading Signals
Procter and Gamble Corporation plotted with 5 day Rate of Change (Volume).
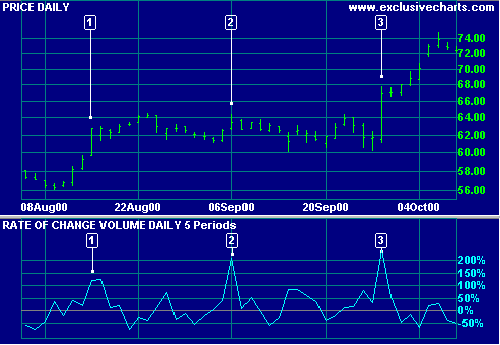
Mouse over chart captions to display trading signals.
Observe the major spikes in volume:
- On entry into the trading range.
- When price makes a new peak during the range.
- On an upward breakout from the range.
Rate of Change (Volume) Formula
First, decide on the number of periods (n) over which to calculate the indicator. This will depend on the time frame that you are analyzing.
Then calculate the Rate of Change (Volume) formula:
( Volume [today] - Volume [n days ago] ) / Volume [n days ago]
Setup
See Indicator Panel for directions on how to set up an indicator.
The default ROC window is 12 days. To alter the default settings - Edit Indicator Settings.

Author: Colin Twiggs is a former investment banker with almost 40 years of experience in financial markets. He co-founded Incredible Charts and writes the popular Trading Diary and Patient Investor newsletters.
Using a top-down approach, Colin identifies key macro trends in the global economy before evaluating selected opportunities using a combination of fundamental and technical analysis.
Focusing on interest rates and financial market liquidity as primary drivers of the economic cycle, he warned of the 2008/2009 and 2020 bear markets well ahead of actual events.
He founded PVT Capital (AFSL No. 546090) in May 2023, which offers investment strategy and advice to wholesale clients.