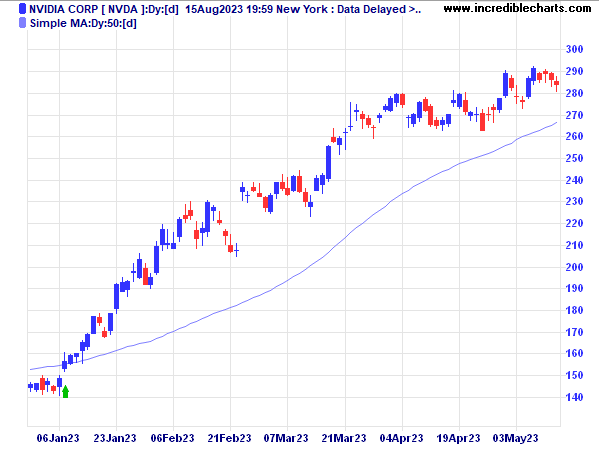
Simple Moving Average (SMA) Indicator
The simple moving average is easy to construct, but not always the most accurate. It is a basic measure of trend direction that is calculated by averaging price data.

Simple Moving Average Formula
To calculate a 5 day simple moving average ("SMA"), take the sum of the last 5 days prices and divide by 5.
| Day | 1 | 2 | 3 | 4 | 5 | 6 | 7 | 8 | 9 |
|---|---|---|---|---|---|---|---|---|---|
| Price ($) | 16 | 17 | 17 | 10 | 17 | 18 | 17 | 17 | 17 |
| 5 Day SMA | 15.4 | 15.8 | 15.8 | 15.8 | 17.2 |
On day 9 there is a big step in the simple moving average, but price has been constant at $17. The low price on day 4 not only causes a drop in the simple moving average on day 4, but also distorts the moving average on day 9 — causing a jump in value when the low price is dropped from the moving average period. That is what is commonly referred to as "barking twice.

