Standard Deviation Channels
Standard deviation channels are plotted at a set number of standard deviations around a linear regression line. They can be usefully applied to swing trading (as well as for detecting changes in momentum).
Visually identify a stable trend on the chart and fit standard deviation channels by dragging your mouse over the selected time period.
Example
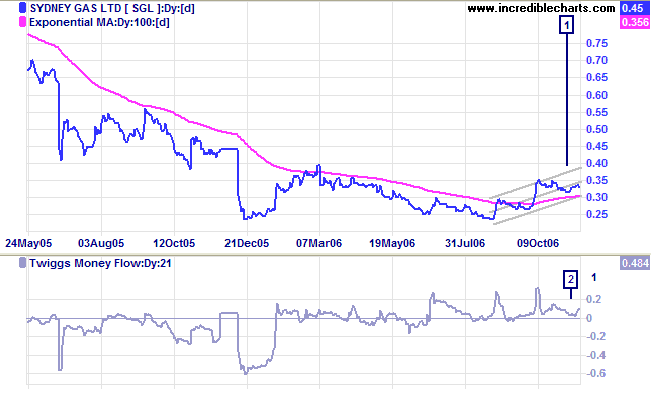
Sydney Gas Limited [SGL] is plotted with trend channels drawn at 2 standard deviations around a linear regression line. After equal lows in December 2005 and August 2006 SGL started to rally.
- The signal to go long is identified when the secondary reaction (or consolidation) at [1] respects the 100-day Exponential Moving Average.
- Accompanied by strong accumulation with Twiggs Money Flow holding above the zero line.
Mouse over chart captions to display trading signals.
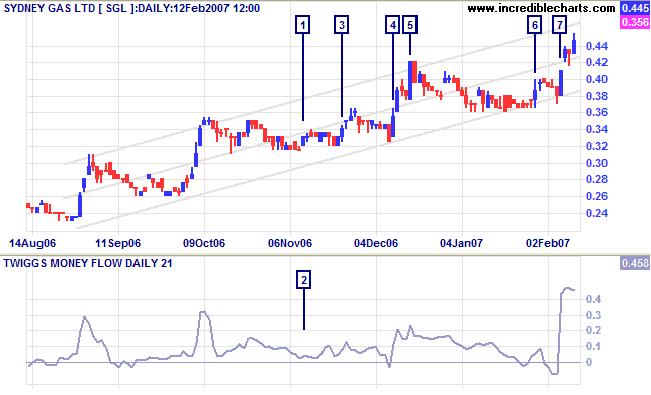
Channel lines are extended using Auto-Extend (right-click on the trendline).
- Opportunity to increase the position presents itself with another higher trough in the lower half of the trend channel
- A further pyramid opportunity
- Exit when price reverses below (or respects) the top trend channel
- Another entry signal when price completes a double bottom
at the lower trend channel
(price is above the 100-day Exponential Moving Average and Twiggs Money Flow has respected zero) - An opportunity to increase (pyramid) your position when price respects the lower channel line.
Mouse over chart captions to display trading signals.
Trend Channel Stop Loss Orders
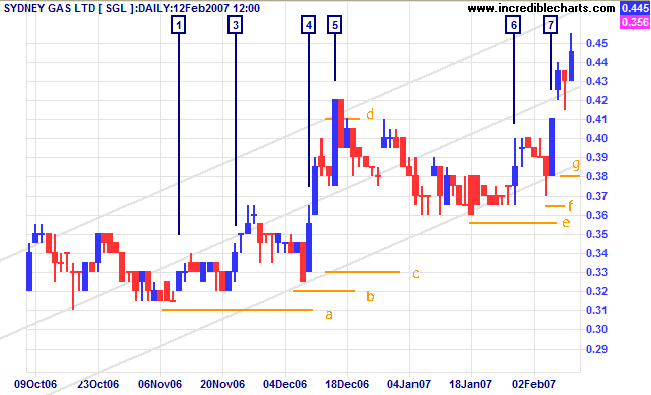
- Place your first stop loss below the down-swing at [1] on which you entered.
- On subsequent troughs, move the stop loss up to below the lesser of:
- the lower channel line, and
- the low of the trough.
- Even if the trough is in the upper half of the trend channel, set the stop loss at the lower channel line.
- When price penetrates the top trend channel, move your stop loss to the upper channel line.
If price breaks clear of the channel, keep on moving your stop up along the upper channel line each time that a new trough respects the channel line.
Mouse over chart captions to display trading signals.
- On the second entry, place your initial stop loss below the trough
- Move the stop loss up to below the subsequent trough, (which is also below the lower channel line)
- The next trough is in the upper half of the trend channel, so set the stop loss at the lower channel line.
Setup
See Help: Trend Channels for directions on how to set up standard deviation channels.
I normally use 2 standard deviations, which enclose roughly 95% of the selected data. Using 3 standard deviations encloses about 99% of the selected data but the channel often appears too wide.

Author: Colin Twiggs is a former investment banker with almost 40 years of experience in financial markets. He co-founded Incredible Charts and writes the popular Trading Diary and Patient Investor newsletters.
Using a top-down approach, Colin identifies key macro trends in the global economy before evaluating selected opportunities using a combination of fundamental and technical analysis.
Focusing on interest rates and financial market liquidity as primary drivers of the economic cycle, he warned of the 2008/2009 and 2020 bear markets well ahead of actual events.
He founded PVT Capital (AFSL No. 546090) in May 2023, which offers investment strategy and advice to wholesale clients.