Stochastic RSI
Stochastic RSI is a momentum oscillator described by Tushar Chande and Stanley Kroll in their book The New Technical Trader. The aim of Stochastic RSI is to generate more Overbought and Oversold signals than Welles Wilder's original Relative Strength oscillator.
Trading Signals
Chande and Kroll suggest setting Overbought/Oversold signals at 80/20 for Stochastic RSI rather than the 70/30 normally used for RSI.
- Go long when Stochastic RSI falls below the Oversold level then recovers above it;
- Go short when Stochastic RSI rises above the Oversold level then crosses below it;
Use a longer term trend filter to ensure that you only take trades in the direction of the trend. Exit on the opposite signal rather than reversing direction.
Example
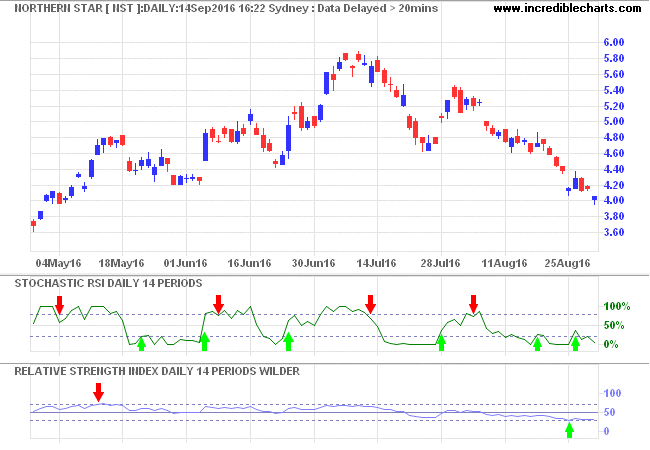
Australian gold miner Northern Star (NST) is plotted with 14-day Stochastic RSI and 14-day Relative Strength (RSI). Both use Wilder moving averages to ensure a fair comparison.

Relative Strength (RSI) generates only one buy and one sell signal, while Stochastic RSI is a lot more active. The first buy signal is too early, while the second is a bit late.
No trend filter has been used. It is clear that the last buy signal (from both indicators) should be ignored as NST has reversed to a down-trend.
Stochastic RSI Trend-Following
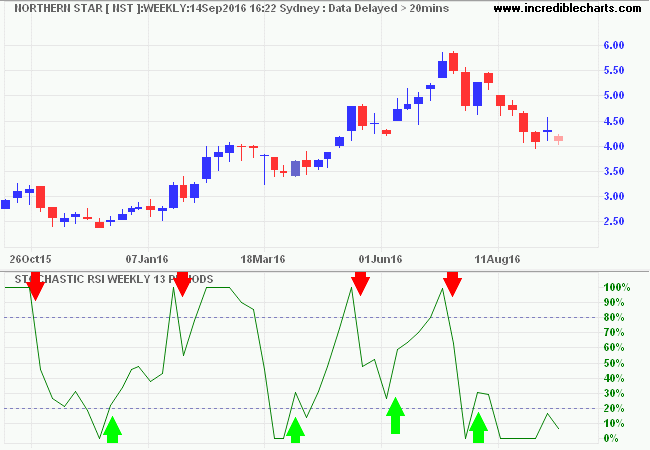
Stochastic RSI is not that appealing as a weekly trend indicator as, like most momentum oscillators, it tends to shake you out of the trend too early. Northern Star (NST) in the example below is plotted with 14-week Stochastic RSI.

Note the failed swing in June 2016 [dark green arrow] which provides a buy signal. Where RSI reverses above 50 without crossing into oversold territory, or reverses below 50 after failing to cross the Overbought line, the failed swing offers a strong trend signal.
Stochastic RSI - Setup
The default setup is 14 time periods, with Overbought/Oversold levels at 80/20.
Select Indicators and Stochastic RSI in the left column of the Indicator Panel. See Indicator Panel for directions. To alter the default settings, see Edit Indicator Settings.
Stochastic RSI Colors
To amend indicator colors, open the legend by clicking "L" on the toolbar or typing "L" on your keyboard. Adjust individual colors by clicking on the color patches next to the indicator in the legend.
Stochastic RSI Formula
Stochastic RSI indicator applies the Stochastic formula to Relative Strength (RSI) indicator values.
Calculate the Relative Strength Index (RSI) for n periods of a data series.
Subtract the minimum RSI value in n periods from the latest current RSI value.
Subtract the minimum RSI value in n periods from the highest RSI value for the same number of periods.
Stochastic RSI is calculated by dividing the first result by the second.
Example
To calculate Stochastic RSI for 14 periods:
Stochastic RSI = [RSI(14,price) - Minimum(14,RSI(14,price))] / [Maximum(14,RSI(14,price)) - Minimum(14,RSI(14,price))]

Author: Colin Twiggs is a former investment banker with almost 40 years of experience in financial markets. He co-founded Incredible Charts and writes the popular Trading Diary and Patient Investor newsletters.
Using a top-down approach, Colin identifies key macro trends in the global economy before evaluating selected opportunities using a combination of fundamental and technical analysis.
Focusing on interest rates and financial market liquidity as primary drivers of the economic cycle, he warned of the 2008/2009 and 2020 bear markets well ahead of actual events.
He founded PVT Capital (AFSL No. 546090) in May 2023, which offers investment strategy and advice to wholesale clients.
