Twiggs® Volatility
Twiggs Volatility is a volatility indicator used to flag elevated market risk. Used primarily on market indexes such as the Dow and S&P 500, Twiggs Volatility may also prove useful in tracking behavior of individual stocks.
Twiggs® Proprietary Indicator
Twiggs Volatility is a proprietary indicator developed by Colin Twiggs.
Twiggs® Volatility Trading Signals
The primary use of Twiggs Volatility is to signal rising (and falling) market risk:
- Rising troughs indicate that market risk is increasing.
- Falling peaks indicate that market risk is declining.
I ignore troughs below 1.0% as Volatility is at a low ebb and any increases are likely to be inconsequential.
Daily and Weekly Volatility are not comparable, so I tend to stick to Daily Twiggs Volatility. Weekly settings are just as serviceable, as long as they are applied consistently and not compared with Daily values.
Measuring Market Risk
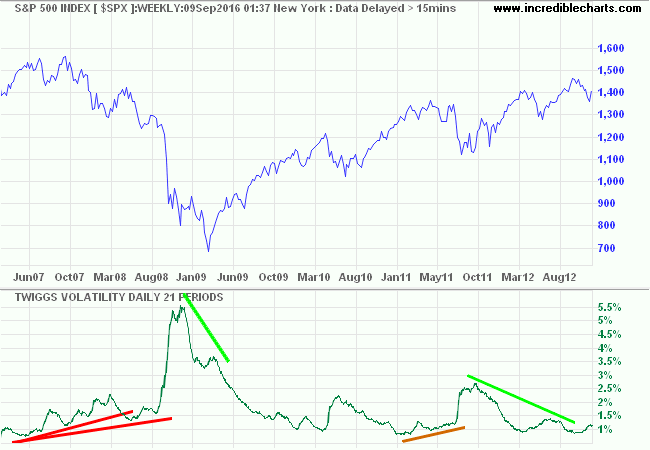
A weekly chart of the S&P 500 index illustrates how Twiggs Volatility is used to highlight rising and falling market risk.
The strongest warning from Twiggs Volatility was the rising troughs in 2007 preceding the 2008 crash. A smaller rise is also visible in 2011.

Sharp declines are also visible in 2009 and 2012, signaling resumption of the up-trend.
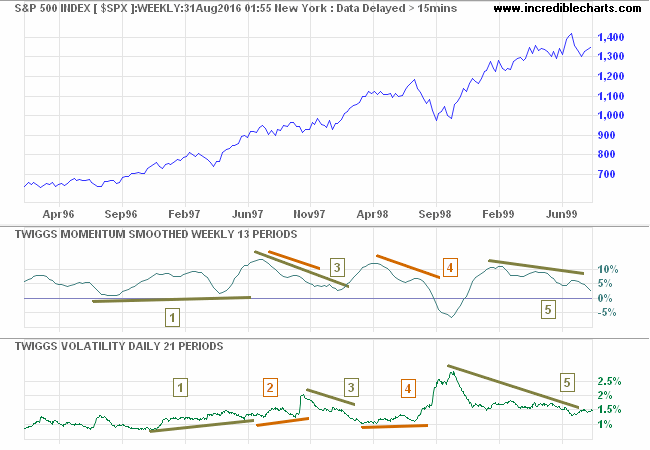
Volatility, including Twiggs Volatility, should not be used as a standalone signal. Rises are normally triggered by sharp price falls but can also be triggered by exceptional rises, as in 1997 [1] below.

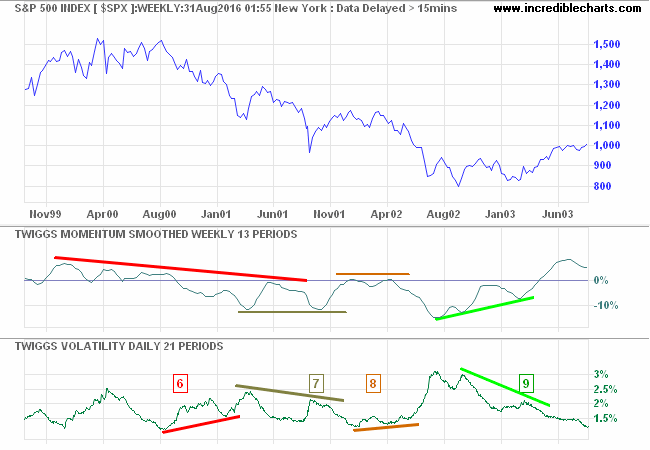
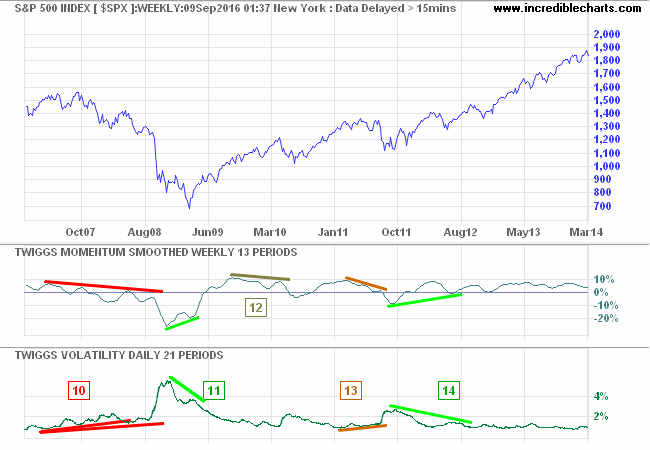
Obtaining confirmation from a trend indicator like Twiggs Smoothed Momentum helps to eliminate false signals.
- Rising troughs on Twiggs Volatility warn of potential risk but rising Twiggs Momentum negates the signal.
- Rising troughs on Twiggs Volatility are confirmed by lower peaks on Twiggs Momentum.
- Declining peaks on Twiggs Volatility in late 1997 are again negated by declining Twiggs Momentum.
- Rising troughs on Twiggs Volatility are confirmed by declining Twiggs Momentum. The signal preceded the Russian default in August 1998 and collapse of LTCM.
- Falling peaks on Twiggs Volatility suggest another bull market but this is again negated by declining Twiggs Momentum.

- Rising troughs on Twiggs Volatility in late 2000/early 2001 warn of potential risk. Declining Twiggs Momentum confirms the signal which preceded the Dotcom crash.
- Declining peaks on Twiggs Volatility in late 2001 are negated by declining Twiggs Momentum.
- Rising troughs on Twiggs Volatility are confirmed by declining Twiggs Momentum.
- Falling peaks on Twiggs Volatility suggest another bull market in early 2003. This is confirmed by rising Twiggs Momentum.

- Rising troughs on Twiggs Volatility in 2007 warn of potential risk. Declining Twiggs Momentum confirms the signal which preceded the 2008 crash.
- Declining peaks on Twiggs Volatility in early 2009 suggest the bear market has ended. Rising Twiggs Momentum confirms.
- Falling Twiggs Momentum in 2010 is not accompanied by rising Twiggs Volatility.
- Rising troughs on Twiggs Volatility warn of rising risk in 2011. This is confirmed by falling Twiggs Momentum.
- Declining peaks on Twiggs Volatility in early 2012 suggest the bull market has resumed. Rising Twiggs Momentum confirms.
Setup
Select Indicators on the chart menu and Twiggs Volatility in the left column of the Indicator Panel. See Indicator Panel for directions on how to set up an indicator. To alter the default settings - Edit Indicator Settings.
Twiggs® Volatility Colors
Open the legend by clicking ![]() on the toolbar
or typing "L" on your keyboard. Adjust individual colors by selecting the color patches next to
each indicator line in the legend.
on the toolbar
or typing "L" on your keyboard. Adjust individual colors by selecting the color patches next to
each indicator line in the legend.

Author: Colin Twiggs is a former investment banker with almost 40 years of experience in financial markets. He co-founded Incredible Charts and writes the popular Trading Diary and Patient Investor newsletters.
Using a top-down approach, Colin identifies key macro trends in the global economy before evaluating selected opportunities using a combination of fundamental and technical analysis.
Focusing on interest rates and financial market liquidity as primary drivers of the economic cycle, he warned of the 2008/2009 and 2020 bear markets well ahead of actual events.
He founded PVT Capital (AFSL No. 546090) in May 2023, which offers investment strategy and advice to wholesale clients.
