Twiggs® Momentum Indicator
Twiggs Momentum Oscillator is a new momentum indicator developed by Colin Twiggs for Incredible Charts. A smoothed version of the Rate Of Change oscillator, its primary purpose is to identify fast trending stocks using the stock screener. It can, however, be successfully used to generate buy and sell signals in a similar fashion to other momentum oscillators.
Twiggs® Momentum Indicator Signals
Identifying Fast Trends
Fast-trends are indicated when Twiggs Momentum Oscillator (21-day):
- Rises above 20%, indicating an up-trend; or
- Falls below -20%, indicating a down-trend.
The indicator period can be adjusted to as low as 5 days, to identify short-term trends, or as high as 12 months, to identify extremely long-term trends (the super-cycle). The percentage gain or loss would have to be adjusted accordingly: to 10% or 100% respectively.
Here is a rough guide to identifying fast-trending stocks with TMO:
- TMO time period below 10 days: use 10%
- 10 to 19 days: use 15%
- 20 to 24 days: 20%
- 25 to 30 days: 25%
- 30 to 34 days: 30%
- 35 to 39 days: 35%
- 40 to 44 days: 40%
- ..............
- 100 days and over: 100%
Example
Apple Inc. [AAPL] is displayed with Twiggs Momentum Oscillator (21 days) and 63-day exponential moving average used as a trend filter.
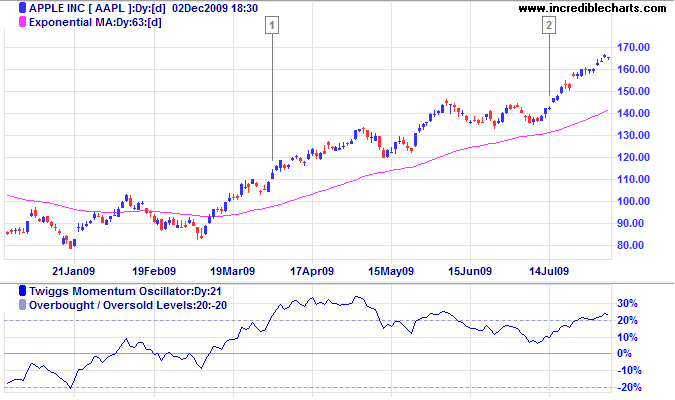
Mouse over chart captions to display trading signals.
- Go long when Twiggs Momentum Oscillator (21 days) rises above 20%, while price is above the 63-day exponential moving average
- Increase long position when Twiggs Momentum Oscillator (21 days) reverses above 10% while price is above the 63-day exponential moving average. Signals can also be taken when Twiggs Momentum Oscillator reverses up by 5% when close to the moving average.
Example 2
Apple Inc. [AAPL] is this time displayed with Twiggs Momentum Oscillator (12-months) to identify long-term trends.
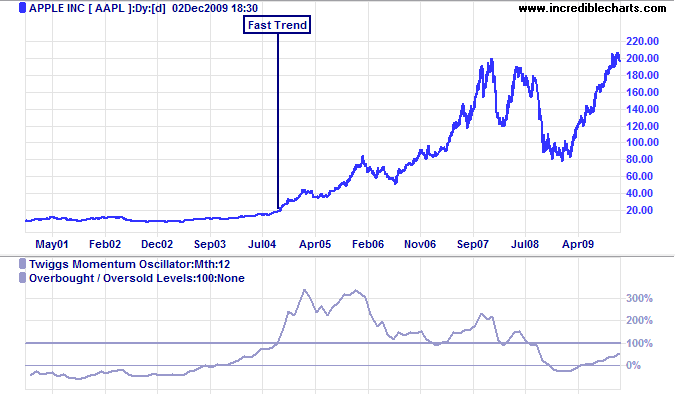
Mouse over chart captions to display trading signals.
- Twiggs Momentum Oscillator (12-months) rising above 100% indicates a strong up-trend in September 2004.
Buy and Sell Signals
The shorter-term oscillator can also be used to generate buy and sell signals in a similar fashion to other momentum oscillators.
First, identify the trend direction using a trend indicator. Twiggs Momentum Oscillator tends to stay above zero during an up-trend and below zero during a down-trend. Only take signals in the direction of the trend.
- In an up-trend, go long if Twiggs Momentum Oscillator turns upwards when below zero.
- In a down-trend, go short if Twiggs Momentum Oscillator turns downward when above zero.
Use trailing buy and sell stops to time your entry and exit. Take profits on divergences and trend line breaks. Exit using a trend indicator.
Trend lines can also be drawn on Twiggs Momentum Oscillator. A break in the trend line often occurs in advance of a similar break on the price chart.
Example 3
Gold miner Resolute Mining Ltd [RSG] is displayed with Twiggs Momentum Oscillator (5-day) and 63-day exponential moving average as a trend filter.
![Resolute Mining Ltd [RSG] With Twiggs Momentum Oscillator](/images/png_images/rsg_twiggs_momentum_5d.png)
Mouse over chart captions to display trading signals.
- Twiggs Momentum Oscillator (5-day) rising above 10% helps to identify a fast-trending stock.
- Go long when Twiggs Momentum Oscillator (5-day) turns up by 5% while below zero and price respects the 63-day moving average.
Setup
The default period is set at 21 days ATR.
See Indicator Panel for directions on how to set up an indicator — and Edit Indicator Settings to change the settings.
Twiggs® Momentum Indicator Formula
Twiggs Momentum Oscillator is based on the Rate Of Change oscillator. The formula is proprietary and is not disclosed.

Author: Colin Twiggs is a former investment banker with almost 40 years of experience in financial markets. He co-founded Incredible Charts and writes the popular Trading Diary and Patient Investor newsletters.
Using a top-down approach, Colin identifies key macro trends in the global economy before evaluating selected opportunities using a combination of fundamental and technical analysis.
Focusing on interest rates and financial market liquidity as primary drivers of the economic cycle, he warned of the 2008/2009 and 2020 bear markets well ahead of actual events.
He founded PVT Capital (AFSL No. 546090) in May 2023, which offers investment strategy and advice to wholesale clients.