Scan for Breakouts
Recent interest in breakouts prompted me to come up with a new, simplified scan.
First of all, let's define a breakout.
Breakouts
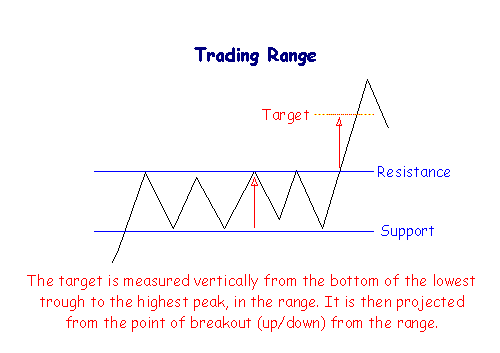
The first requirement for a breakout is a broad trading range. The stock must have been moving sideways for a considerable time — the longer, the better. Remember the old maxim "the broader the base, the higher into space."
The second feature to look for is narrow height. The closer support and resistance are to each other, the greater the compressed energy that will be released at a breakout.

A third element to look out for is rising volume before the breakout, indicating strong buyer interest overcoming resistance. Also, strong volume immediately after the breakout strengthens the signal.
Breakout Target
Finally, the general rule for calculating the target for a breakout is to project the height of the base above the breakout point (as in the earlier illustration). But where the base has a narrow height, we should use the height of the previous advance, calculated from the current resistance level (in the range) to the previous resistance level before the last advance.
Scanning for Breakouts
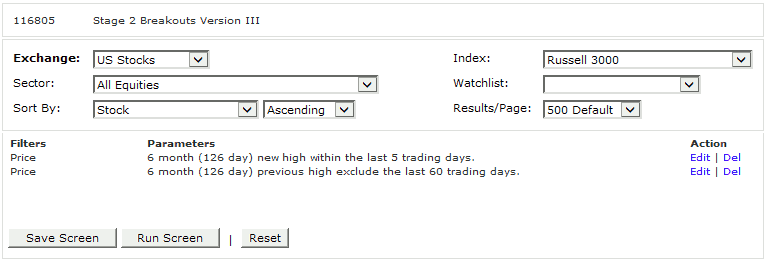
Filters for the scan are relatively simple:
- The first step is to filter for a recent 6-month high.
- But that will include many trending stocks, so we eliminate stocks where the previous high occurred in the last 60 days.

Example #1
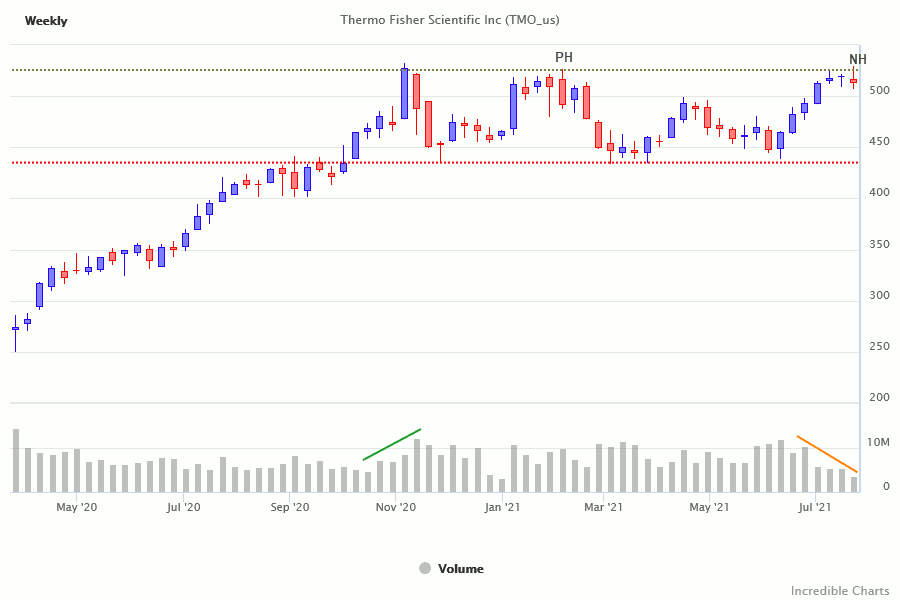
Thermo Fisher Scientific (TMO) recently flagged a breakout to a new 6-month high (NH), with a previous high (PH) in February '21.

- The breakout was not supported by rising volume and quickly retraced. Expect a test of support at 500. Respect of support would be a bullish sign.
- Add to a watchlist with an alert set at 525. Breakout in the next few weeks on rising volume would be a strong bull signal, with a target of 600 (support at 440 projected above resistance at 520).
Example #2
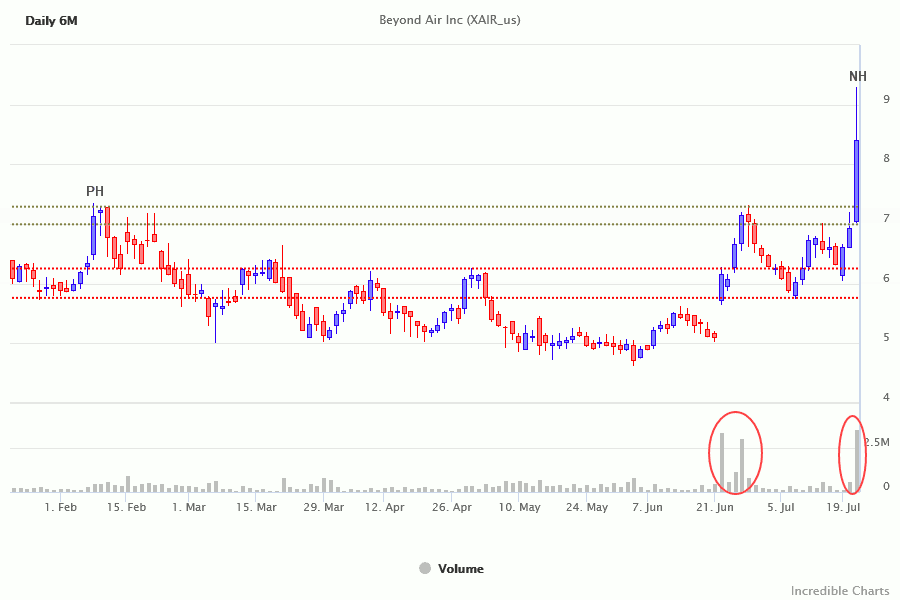
Beyond Air (XAIR) turned up in the same screen of Russell 3000 stocks, making a new 6-month high (NH) after an earlier high in February '21.

- The base is not a conventional rectangular consolidation, with XAIR instead forming a cup-and-handle pattern over the past 6 months. Breakout would still be a strong bull signal.
- Strong volume confirmation on the rally in June '21 and again in July on the breakout.
- Expect retracement to test the new support level at 7.00, respect would be a strong bull signal, confirming an advance with a target of 9.00 (support at 5.00 projected above resistance at 7.00).
Scanning for Breakouts: Setup
No need to set up your own filters. There are two shared screens that you can run as they are, else modify to suit your purpose:
- #116805 - Russell 3000 breakouts
- #116808 - ASX 300 breakouts
Click on the Shared tab and search for the above ID.

Then select View or Run.

Author: Colin Twiggs is a former investment banker with almost 40 years of experience in financial markets. He co-founded Incredible Charts and writes the popular Trading Diary and Patient Investor newsletters.
Using a top-down approach, Colin identifies key macro trends in the global economy before evaluating selected opportunities using a combination of fundamental and technical analysis.
Focusing on interest rates and financial market liquidity as primary drivers of the economic cycle, he warned of the 2008/2009 and 2020 bear markets well ahead of actual events.
He founded PVT Capital (AFSL No. 546090) in May 2023, which offers investment strategy and advice to wholesale clients.
