How to Identify Momentum Stocks on the ASX
We have reorganized our scans of sector indices to enable users to more easily identify top-performing momentum stocks.
The example here scans for Australian (ASX) stocks. There is a copy of the scan saved (#123577) on the Shared tab or you can set it up yourself as shown below.
There is a further example here for US stocks.
More about Momentum
Momentum measures the rate of gain (or loss) and provides an easy way to compare performance of sectors, industries, sub-industries and their component stocks.
You can find out more about our favorite oscillator at Twiggs Momentum.
For academic research, see the series of articles on Momentum Trading, written by Dr Bruce Vanstone.
Scan ASX Industry Groups
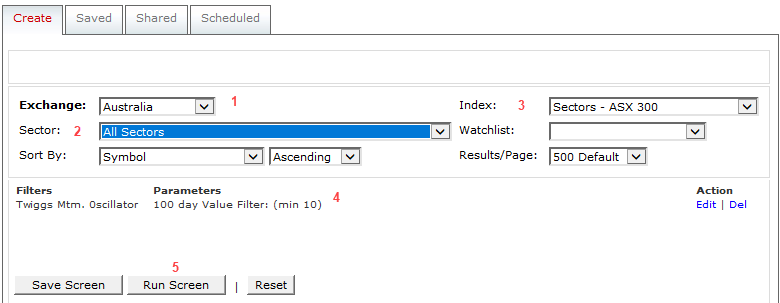
- Open the Stock Screener (Securities >> Stock Screen on the chart menu or type "X" on your keyboard)
- Set up the filters:
- Exchange: Australia
- Sectors: All Sectors (important - you are scanning sector indices, not stocks)
- Index: Sectors - ASX 300
- Add the indicator: Twiggs Momentum 100-Day, Minimum 10 (lower than the US because we are sorting by industry group and there are also far fewer stocks)
- Click the Run Screen button
- Order the Returned list by clicking on the header [1] and select the first line [2]

- Hit Enter or click on the highlighted line to open an index chart
- Scroll the returned list of indices using the up/down arrows on the toolbar or on your keyboard

Select Top-Performing Industries
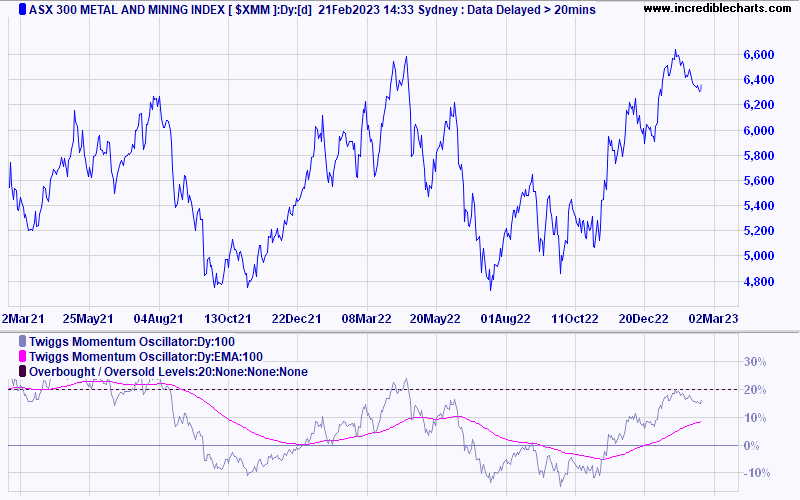
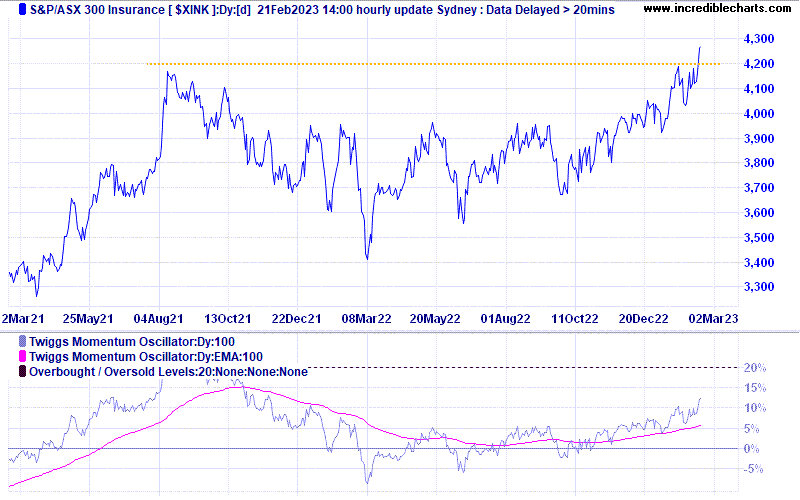
- Scroll through the industry charts, looking for recent breakouts. Ideally Twiggs Momentum (100-Day) should have crossed above 10 and the index should make a new long-term high.
The Metals & Mining ($XMM) index is testing resistance.
While the Insurance Index shows a breakout above 4200.
Scan for Momentum Stocks
Selected an appropriate index (e.g. Insurance) and run a scan for component stocks with strong momentum:

- Set up the filters to scan the selected Insurance industry group:
- Exchange: Australia
- Sector: Insurance
- Index: ASX 300
- Add the indicator: Twiggs Momentum 100-Day, Minimum -99 (normally 10 or 20 but you want to see all stocks in the sub-industry)
- Click the Run Screen button
- Order the Returned list by clicking on the header [1] and select the first line [2]

- Hit Enter or click on the highlighted line to open a stock chart
- Scroll the returned list of stock using the up/down arrows on the toolbar or on your keyboard

Select Top-Performing Stocks
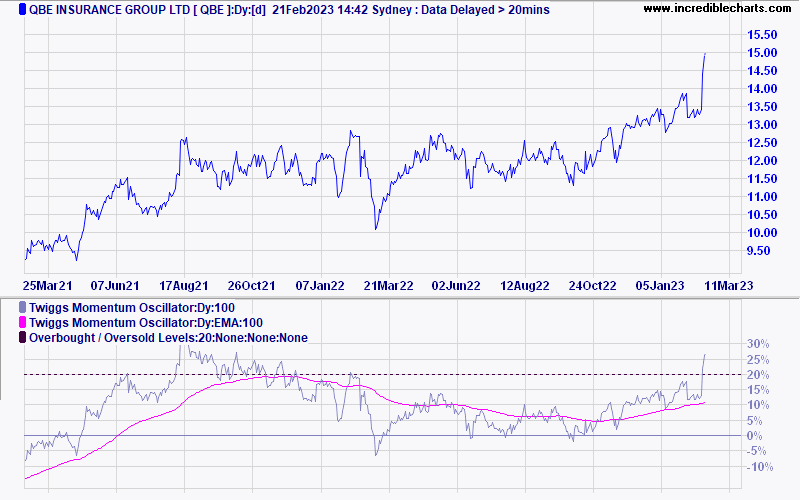
Select individual stocks using similar criteria -- rising Momentum and new long-term highs:
QBE Insurance (QBE) shows a strong breakout.
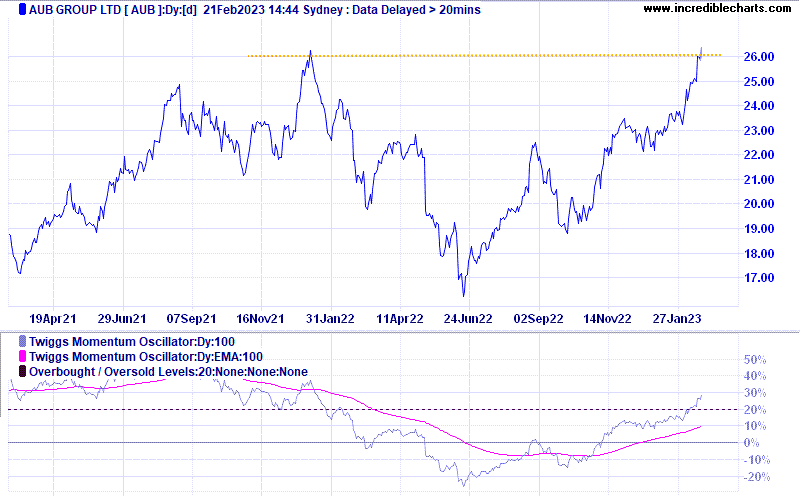
AUB Group (AUB) had a sharp fall in 2022 but has since shown a strong recovery.

Author: Colin Twiggs is a former investment banker with almost 40 years of experience in financial markets. He co-founded Incredible Charts and writes the popular Trading Diary and Patient Investor newsletters.
Using a top-down approach, Colin identifies key macro trends in the global economy before evaluating selected opportunities using a combination of fundamental and technical analysis.
Focusing on interest rates and financial market liquidity as primary drivers of the economic cycle, he warned of the 2008/2009 and 2020 bear markets well ahead of actual events.
He founded PVT Capital (AFSL No. 546090) in May 2023, which offers investment strategy and advice to wholesale clients.
