Trade Trends with Bollinger Bands & Twiggs® Money Flow
This strategy originated from Nick Radge's book Unholy Grails, where he uses 100-day Bollinger Bands to capture trend momentum. The rules are simple:
- Enter when price closes above the upper Bollinger Band
- Exit when price closes below the lower Bollinger Band
Nick proposes setting the upper band at 3 standard deviations and the lower band at 1 standard deviation but I am wary of this (too much like curve-fitting) and would stick to bands at 2 standard deviations.
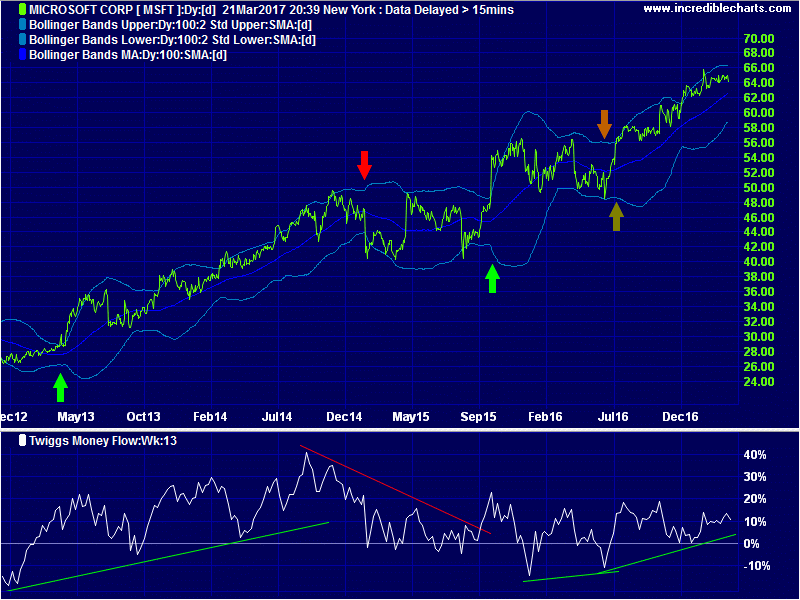
Here I have plotted Microsoft with 100-day Bollinger Bands at 2 standard deviations and 13-week Twiggs Money Flow to highlight long-term buying and selling pressure.

- Green arrow = Long entry
- Red arrow = Exit
- Orange = Invalid exit
- Olive = Potential entry
- Go long in 2013 when MSFT crosses above the upper Bollinger Band. Exit when price falls below the lower band in 2015.
- Ignore the next possible long entry signal in April 2015 because Twiggs Money Flow signals a bearish divergence.
- Go long in October 2015 when price closes above the upper band.
- The orange arrow in June 2016 highlights a potential exit when MSFT traded intra-day below the lower Bollinger Band. But the day's close is above the band, so this was not a valid exit signal.
- The olive green arrow in July 2016, when MSFT closed above the upper band, is therefore not an entry signal as the October 2015 trade is still open. But it can be used as an entry by traders who want to pyramid their position, with a stop below the recent low at $48.
The problem with momentum strategies is eye-watering drawdowns. Do not use this strategy to trade stocks when there is not a strong trend. Also, don't trade against the overall market:
- Don't short in a bull market
- Don't go long in a bear market.
Try Incredible Charts Premium
Trade Bollinger Band Trends and many other exciting trading strategies with Incredible Charts charting software.
