Captions
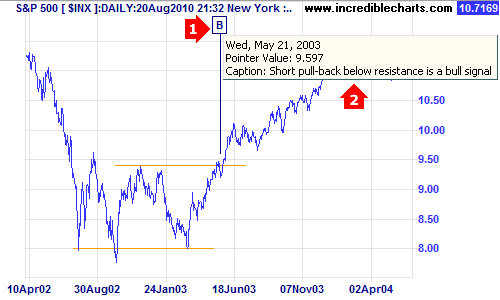
Captions are used to highlight and remember important events and information. Captions consist of:
- A Caption Marker that identifies the Caption. Leave blank to number sequentially.
- A Caption that displays when your mouse pointer is over the Caption Marker.

Captions and Caption Markers can contain up to 256 characters.
Add Caption
- Click
 the Add Caption icon on the toolbar
 - Click your mouse at the point on the chart where you want to place the Caption.
- Enter your caption marker and click OK.
- Enter your caption and click OK.
Hide Caption
- Right-click on the
 Caption icon on the toolbar.
 - Clear the box next to Show Captions.

- Right-click on the
 Caption icon on the toolbar.
 - Select Show Captions.
Edit Caption
- Right-click on the Caption Marker on the chart. A dialog box appears.
- Edit the Caption in the dialog box and then click OK.
- A second dialog box appears. Edit the Caption and then click OK.
Move a Caption
- Click the anchor at the bottom end of the Caption Marker and drag it to a new position.
Delete Caption
- Click the
 Delete Trendline or Caption icon on the toolbar
 - Click the Caption that you want to delete.
Delete All Captions:
From a Specific Security
- Ensure that the correct security is open.
- Select Draw >>
 Delete All Captions
 - Click Yes at the prompt.
On a Specific Chart
- Right-click on the chart.
- Select
 Delete this Chart's Options on the list that appears
 - Click Yes at the prompt.
Next: Time Periods
