Select a Chart Type
Toolbar

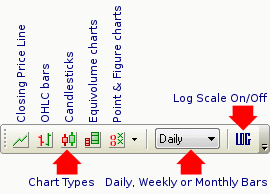
Use the Chart View toolbar to select a Chart Type and Daily, Weekly or Monthly bars.
The drop-down arrow next to the Point & Figure icon displays all loaded P&F options.
View Menu
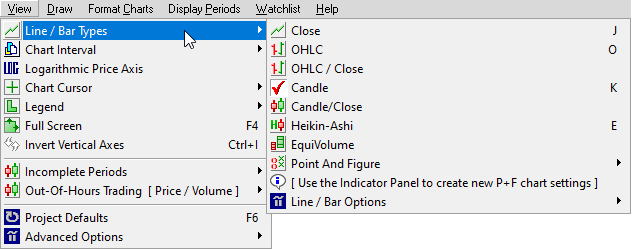
The View menu offers further chart view options:

Chart Types
Close
The chart will plot closing price only, as a line.
OHLC
Chart bars display Open, High, Low and Close. See Trading Guide: Chart Basics for further details.
OHLC/Close
The same as OHLC except that daily charts longer than 6 months will revert to closing price only.
Candle
The chart bars will display as candlesticks. See Trading Guide: Candlesticks for further details.
Candle/Close
The same as Candle except that daily charts longer than 6 months will revert to closing price only.
Equivolume
Equivolume charts can also be viewed with daily, weekly or monthly bars. The bars display the same information as candlesticks, except that, in addition, bar width indicates volume. You can amend Equivolume bars back to the original Incredible Charts format:
- Select View >> Advanced Options >> Display Equivolume HLC
- This will display only High, Low and Close, and not the Open.
- Chart colors are also determined differently: in the same fashion as an OHLC chart.
See Trading Guide: Equivolume for further details.
Point and Figure
Point and Figure Charts do not use a time scale. See Trading Guide: Point and Figure Charts for further details.
Use the Indicator Panel to set up new point and figure options.
