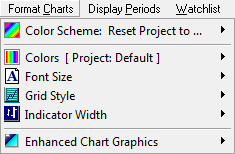
Format Charts
Format Charts enables you to customize the appearance of your charts.

Color Schemes
To select a new color scheme:
- Click Format Charts
- Place your mouse pointer over
 Color Scheme: Reset File to ...
A list will appear. - Select a Color Scheme from the list.
Colors
- Open Chart Format on the main menu.
- Place your mouse pointer over
 Colors.
A drop-down list appears of all the basic chart colors (background, text, grid, trendlines, caption markers, etc.) followed by a list of all the chart types included in the open file.
Altering a Basic Chart Color
Example: To alter the background color:
- Open the
 Colors menu.
 - Select Background from the drop-down list. A standard color palette is displayed.
- Select a color from the palette by clicking on it.
- Click OK to record your choice.
Altering an Indicator Color
Example: To alter the color of a 20-day exponential moving average on the main price chart:
- Open the
 Colors menu.
 - Place your mouse pointer over Price Daily in the list of charts on the drop-down list.
A list of all the indicators on the Price Daily chart appears. - Select Exponential Moving Average: Daily: 20 periods from the list.
A standard color palette is displayed. - Select a color from the palette by clicking on it.
- Click OK to record your choice.
Font Size
- Open Chart Format on the main menu.
- Place your mouse pointer over
 Font Size. A list appears of all available font sizes.
 - Click on the required font size.
Grid Style
- Open Chart Format on the main menu.
- Place your mouse pointer over
 Grid Style. A list appears of all available grid styles.
 - Click on the required grid style.
Indicator Width
- Open Chart Format on the main menu.
- Place your mouse pointer over
 Indicator Width. A list appears of all available widths.
 - Click on the required width.
Enhanced Graphics
- Open Chart Format on the main menu.
- Place your mouse pointer over
 Enhanced Chart Graphics.
 - Select Enhanced for smoother trendlines and other anti-aliasing benefits.
Select Normal to return to the standard graphics option.
Next: Trendlines
