Trendlines
A trendline measures the rate of increase in the share price over time and alerts you to any acceleration or deceleration of the trend. Trendlines can also be used to highlight support and resistance levels, trends, chart patterns and overbought/oversold levels.
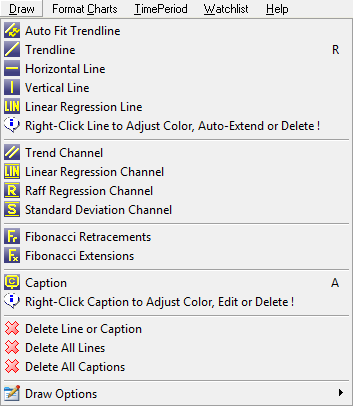
There are several trendline options on the Draw menu:

These are also found on the Draw toolbar for convenience:
Drawing trendlines is time consuming, so use stock screens to identify the most likely candidates and concentrate on these. See Trend Lines for basic trend analysis details.
Add A Trendline
Auto-Fit Trendline
To automatically fit a trendline to selected data:
- Select
 Autofit Trendline on the toolbar;
 - Drag your mouse above (down-trend) or below (up-trend) the price bars for the period
- Select from Closing Price (long time periods) or Highs/Lows (short-term);
- The trendline will be drawn automatically;
- Drag the right anchor if you want to manually re-position the trendline.
For an up-trend the trendline will automatically fit to the lowest point and the second lowest trough in the given time period. For a down-trend the trendline automatically fits to the highest point and the second highest peak in the given time period.
Manual Trendline
To manually fit a trendline to the data:
- Select
 Trendlines on the toolbar, or type R on your keyboard.
 - Click at the point on the chart where you want to start the trendline and drag it into position.
Linear Regression Line
To automatically fit a linear regression line:
- Select
 Linear Regression Line on the toolbar;
 - Click at the point on the chart where you want to start the trendline and drag it into position.
Horizontal Line
To draw a horizontal line:
- Select
 Horizontal Line on the toolbar.
 - Click your mouse at the point on the chart where you want to place the horizontal line.
The Horizontal Line will automatically extend to the right-edge of the chart unless you adjust the default setting at Draw >> Draw Options >> Horizontal Lines >> Auto-extend as Default.
Vertical Line
Fit a vertical line across the entire chart by clicking at a selected point.
Also, right-click and select Apply to Project -- to apply the same line to all charts in a project.
To create a vertical line:
- Select
 Vertical Line on the toolbar.
 - Click your mouse at the point on the chart where you want to place the vertical line.
Apply Vertical Line To Project
To display the Vertical Line on all charts in your project:
- Right-click the Line
- Select Apply to Project on the list of properties

Modify Trendlines
Auto-Extend Trendline
To automatically extend a trendline to the latest date (or right-edge of the chart):
- Right-click the Trendline
- Select Auto-extend Line on the list of properties

To halt the AutoExtend, right-click on a trendline and un-check AutoExtend Trendline.
Adjust Trendline
To drag one end of the trendline to a new position:
- Place your mouse over the end of the trendline and wait for the square to appear.

- Click the anchor at the end of the Trendline and drag to a new position.
Move a Trendline
To drag a trendline to a new position while retaining the existing angle:
- Place your mouse over the trendline (at any point except the anchors at the ends);
- Wait for the trendline to be highlighted and the hand to appear.

- Click and drag to a new position.
Change a Trendline to Horizontal
To change a normal trendline to horizontal:
- Right-click the Trendline
- Select Horizontal Line on the list of properties

Hide Trendlines
Right-click on one of the trendline icons and clear the box next to Show Lines. Alternatively, use Ctrl + T.

To display hidden trendlines right-click on a trendline icon and select Show Lines.
Delete Trendline
To delete a specific trendline, click ![]() Delete on the toolbar, then select the trendline.
Delete on the toolbar, then select the trendline.
Alternately double-click on the anchor at the end of a trendline, or right-click on the anchor at the end of a trendline and select Delete Line.

Delete All Trendlines
On a specific chart
- Right-click on the chart.
- Select
 Delete this Chart's Drawn Lines on the list that appears.
 - Click Yes at the prompt.
For a specific security in all projects
- Ensure that the correct security is open.
- Select Draw >>
 Delete All Lines.
 - Click Yes at the prompt.
Next: Captions
