Getting Started: Working with Projects
What are Projects?
A project is a file that contains its own:
- indicators;
- trendlines;
- captions; and
- chart format.
Projects do not contain price data which is stored separately.
Why use Projects?
Separate projects enable you to customize charts for specific purposes:
- More than one trading system;
- Groups of indicators;
- Daily, weekly and monthly studies with default time periods and chart intervals; and/or
- Sectors or industry groups with their own indices.
Do I have to use Projects?
No, some users are content to use the Default project alone. Incredible Charts always opens with the Default project file; if you do not want to use projects do not open another project. This allows the program to 'remember' your settings, views and trendlines between sessions.
Select a Project
Incredible Charts always opens with the Default project file. To open a different project, select a recently used project from the bar below the charts:
To display the full list of projects, use the ![]() button, or File >> Open Project.
button, or File >> Open Project.
Create a Project
To create a new project:
- Select File >>
 New Project on the chart menu
 - Enter a new name and click OK
- Then customise your project as required
We have also [pre-loaded] a number of indicator studies in the project menu.
Customize a Project
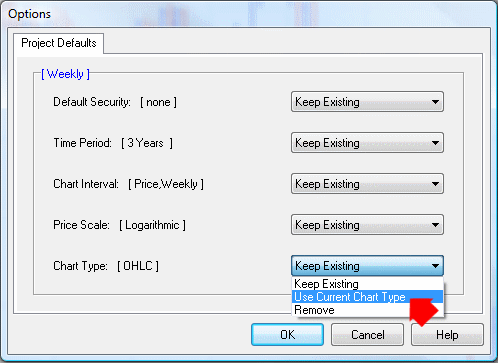
Customise your project by setting Project Defaults [F6], adjusting the Chart Format, and adding indicators. Use the Indicator Panel to add indicators, and the Format Charts menu to set a specific color scheme, font size, grid or indicator width. To set Project Defaults:
- Open the project and set your chart as you want it to display;
- View >> Project Defaults [F6] opens the Options window

- Leave Default Security unless the project is intended for a specific stock or index
- Set Time Period, Chart Interval, Price Scale and Chart Type to Use Current...
- Click OK
