Projects: Set Defaults
You may want to create more than one project, each with a different appearance.
- Format Charts allows you to create a separate color scheme for each project;
- Indicator Panel creates indicators for a specific project; and
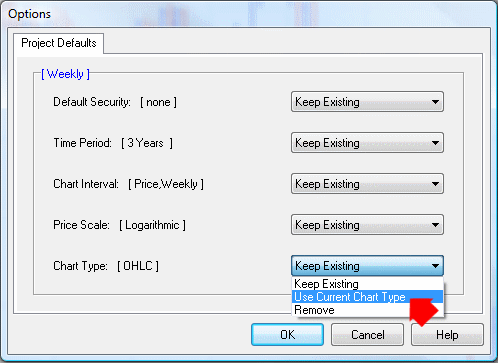
- File >> Project Defaults controls how the project opens:
- On a specified security;
- The time period;
- Chart Interval - whether daily, weekly or monthly; and
- Chart Type - whether OHLC, Candles or Closing Price.

Daily, Weekly, Monthly, Equivolume and Point & Figure Projects
Pre-set project files are available at File >> Open Project (or on the bottom project tab).
See examples below.
Note that the pre-set daily project is called Default.
Creating your own Project Defaults
- Set up a chart as you want it to appear on opening the project;
- Select View >> Project Defaults or simply use the F6 shortcut key;
- Existing defaults are displayed in [square brackets]
[Weekly] at the top of the above example is the project name; - Amend the settings by selecting either:
- Use Current Chart Type to create a new default; or
- Remove to clear an existing default;
- Click OK when completed.
Options
Default Security
Only set this if you want the project to open every time on a specific security, such as the S&P 500. It should be left blank if you are creating separate Daily, Weekly and Monthly projects; or a specific study to be used in conjunction with other projects (e.g. Multiple Moving Averages).
Time Period
Time period can be varied from 1 Month to 10 Years or longer.
Chart Interval
Daily, weekly or monthly chart interval. This can also be used to set Equivolume or Point & Figure charts as the default.
Price Scale
Logarithmic or Normal price scale.
Chart Type
Select from OHLC, Candles or Closing Price.
Examples
Here are some of Colin's favorite project defaults:
| Project: | Default* | Weekly | Monthly | PnF | PnF Index |
|---|---|---|---|---|---|
| Default Security: | none | none | none | none | none |
| Time Period: | 3 Months | 3 Years | 6 Years | 3 Years | 3 Years |
| Chart Interval: | Daily | Daily** | Daily** | Box 5 Reversal 2 Closing Price |
Box 1*** Reversal 2 Closing Price |
| Price Scale: | Normal | Log | Log | Normal | Normal |
| Chart Type: | Candle/Close | OHLC/Close | OHLC/Close |
Notes:
* The Default project doubles as the pre-set "daily" project file
** Colin prefers the Closing Price line graph but many will select weekly and monthly intervals
*** Use a smaller P&F box size of 1 for low volatility stocks and indices
Appropriate indicators can be added to each project.
Next: Watchlists
