Indicators
The Indicator Panel is used to add, edit and delete indicators in the open project. It is also used to change the settings for Point & Figure charts.
Open the Indicator Panel
Select Indicators on the main menu to open the Indicator Panel.
Adding Indicators
- Select an indicator in the left column.
- Adjust the indicator's settings in the center panel.
- Click
 to save the indicator.
 - Click
 to close the Indicator Panel.
Daily, Weekly and Monthly Charts
Separate charts are created for daily, weekly and monthly views. With Incredible Charts you can, for example, add Daily indicators to a Monthly chart or Weekly indicators to a Daily chart.
- Use the View menu to change between Daily, Weekly or Monthly bars. Alternatively, use the F7, F8 and F9 shortcut keys, or use the drop-down menu on the toolbar:

Edit an Indicator
All selected indicators (for the open file) are displayed in the column on the right. To edit an indicator:
- Open the Indicator Panel
- Select the indicator from the right-hand column.
- Amend the settings in the center panel using the up- or down- arrows or type over the existing numbers.
- Click
 to save the new settings.
 - Click
 to close the Indicator Panel.
Delete an Indicator
- Open the Indicator Panel
- Select the indicator in the right-hand column
- Click
 to remove the indicator.
 - Click
 to close the Indicator Panel.
Indicator Smoothing
This is an advanced feature that enables you to smooth your indicator results or add a signal line with a moving average. Details can be found at Indicator Smoothing.
Pre-set Indicators
To select a pre-set trading system, for example Multiple Moving Averages:
- Select File >> Open Project >> [Multiple Moving Averages]
- or select [Multiple Moving Averages] from the project tabs
Adding Relative Strength
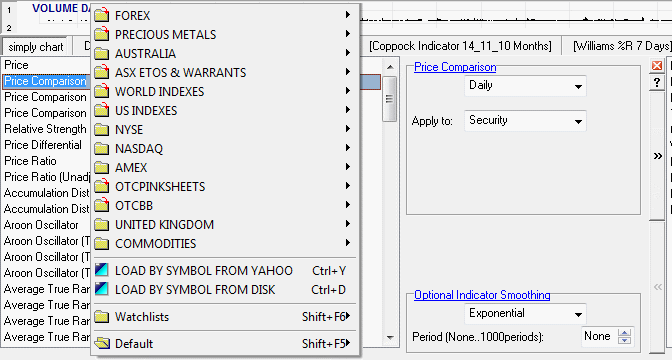
The Relative Strength Indicator is set up using the Price Comparison Indicator.
- Open the Indicator Panel and select Price Comparison at the top of the left column.

- Select an Index:
- For example, select the S&P 500 [SPX] under Indexes or All Ordinaries [XAO] under Australia.
- Amend the Default Settings in the Center Panel
- Select Daily, Weekly or Monthly
- Select Apply to Project if you want Relative Strength to display all stocks; Apply to Security if you only want to display RS for the current stock.
- Save and Close
- Click
 to save an indicator.
 - Click
 to close the Indicator Panel.
- Click
