Time your Exits with Average True Range (ATR) Trailing Stops
The ATR Trailing Stop is a stop loss system that adjusts according to the volatility of a trend and rachets up over time in order to lock in profits and protect capital. The stop trails behind price by a selected multiple of Average True Range (ATR).
They can also be used, in conjunction with a trend filter, to signal entries.
Average True Range ("ATR") was introduced by J. Welles Wilder in his 1978 book New Concepts In Technical Trading Systems. ATR is a measure of volatility for a stock or index and is explained in detail at Average True Range. Wilder experimented with trend-following Volatility Stops using average true range. The system was subsequently modified to what is commonly known as ATR Trailing Stops.
ATR Trailing Stop Signals
Signals are used for exits:
- Exit your long position (sell) when the price crosses below the ATR trailing stop line.
- Exit your short position (buy) when the price crosses above the ATR trailing stop line.
While not conventional, they can also signal entries — in conjunction with a trend filter.
Example
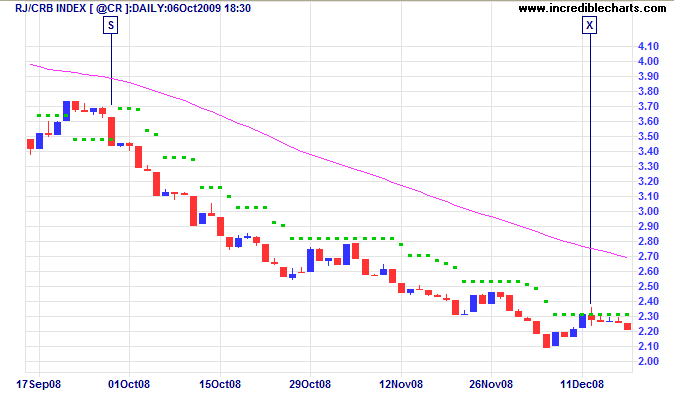
The RJ CRB Commodities Index's late 2008 downtrend is displayed with an Average True Range Trailing Stop (21 days, 3xATR, Closing Price) and a 63-day exponential moving average used as a trend filter.

Mouse over chart captions to display trading signals.
- Go short [S] when the price closes below the ATR stop — while below the 63-day exponential moving average
- Exit [X] when the price crosses above the ATR stop
Setup
Typical ATR time periods vary between 5 and 21 days. Wilder originally suggested using 7 days, short-term traders use 5, and longer-term traders use 21 days. Multiples between 2.5 and 3.5 x ATR are normally applied for trailing stops, with lower multiples more prone to whipsaws.
The default is set as 3 x 21-day ATR.
Closing Price is set as the default option. The alternative is HighLow (see Formula below).
See Indicator Panel for directions on how to set up an indicator — and Edit Indicator Settings to change the settings.
ATR Trailing Stops Formula
Trailing stops are normally calculated relative to the closing price:
- Calculate Average True Range ("ATR")
- Multiply ATR by your selected multiple — in our case 3 x ATR
- In an up-trend, subtract 3 x ATR from the Closing Price and plot the result as the stop for the following day
- If the price closes below the ATR stop, add 3 x ATR to the Closing Price — to track a Short trade
- Otherwise, continue subtracting 3 x ATR for each subsequent day until the price reverses below the ATR stop
- We have also built a ratchet mechanism so that ATR stops cannot move lower during a Long trade or rise during a Short trade.
The HighLow option is a little different: 3xATR is subtracted from the daily High during an up-trend and added to the daily Low during a down-trend.
ATR Trailing Stops Evaluation
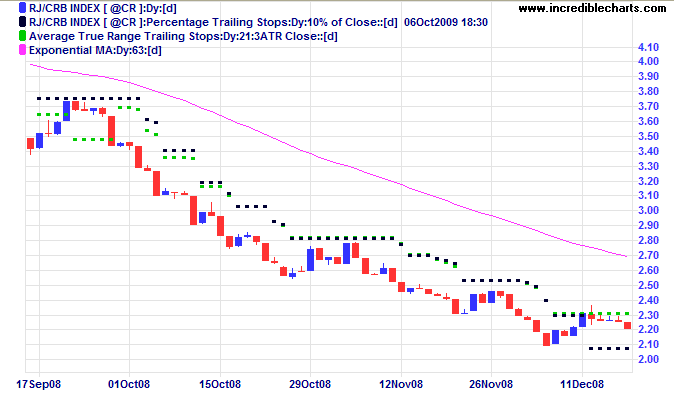
Average True Range Trailing stops are far more volatile than stops based on moving averages and are prone to whipsaw you in and out of positions except where there is a strong trend. That is why it is essential to use a trend filter. Average True Range Trailing stops are more adaptive to varying market conditions than Percentage Trailing Stops but achieve similar results when applied to stocks that have been filtered for a strong trend.

Original ATR and Volatility Stops have two significant weaknesses:
- Stops move downwards during an up-trend if Average True Range widens. I am uncomfortable with this: stops should only move in the direction of the trend.
- The Stop-and-Reverse mechanism assumes that you switch to a short position when stopped out of a long position and vice versa. What is just as likely in a trend-following system is that a trader is stopped out early — and their subsequent entry is in the same direction as their previous trade.
We have introduced a ratchet mechanism (described above) to address the first weakness. The second can be dealt with by using ATR Bands.

Author: Colin Twiggs is a former investment banker with almost 40 years of experience in financial markets. He co-founded Incredible Charts and writes the popular Trading Diary and Patient Investor newsletters.
Using a top-down approach, Colin identifies key macro trends in the global economy before evaluating selected opportunities using a combination of fundamental and technical analysis.
Focusing on interest rates and financial market liquidity as primary drivers of the economic cycle, he warned of the 2008/2009 and 2020 bear markets well ahead of actual events.
He founded PVT Capital (AFSL No. 546090) in May 2023, which offers investment strategy and advice to wholesale clients.
