Chaikin Oscillator
Marc Chaikin uses the Chaikin Oscillator to monitor the flow of money in and out of the market - comparing money flow to price action helps to identify tops and bottoms in short and intermediate cycles. He suggests that it be used in conjunction with a 21 day price envelope and an overbought/oversold indicator (such as Momentum or RSI).
The Chaikin Oscillator is calculated by subtracting a 10 period exponential moving average from a 3 period exponential moving average of the Accumulation Distribution line.
Chaikin Oscillator Trading Signals
The best signals are divergences:
- Go long on a bullish divergence.
- Go short on a bearish divergence.
Example
Microsoft Corporation with Price envelopes (at 10% around a 20 day exponential moving average) and Chaikin oscillator.
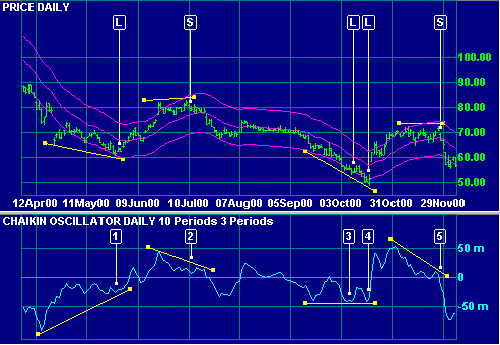
Mouse over chart captions to display trading signals.
- Go long [L] on bullish divergence.
- Go short [S] on bearish divergence.
- Go long [L] on bullish divergence. This position is stopped out when price falls below the recent low.
- Bullish triple divergence. Re-enter long position [L].
- Go short [S] on bearish divergence.
Setup
See Indicator Panel for directions on how to set up Chaikin Oscillator. The default exponential moving averages are:
- slow - 10 days
- fast - 3 days
To alter the default settings - Edit Indicator Settings.

Author: Colin Twiggs is a former investment banker with almost 40 years of experience in financial markets. He co-founded Incredible Charts and writes the popular Trading Diary and Patient Investor newsletters.
Using a top-down approach, Colin identifies key macro trends in the global economy before evaluating selected opportunities using a combination of fundamental and technical analysis.
Focusing on interest rates and financial market liquidity as primary drivers of the economic cycle, he warned of the 2008/2009 and 2020 bear markets well ahead of actual events.
He founded PVT Capital (AFSL No. 546090) in May 2023, which offers investment strategy and advice to wholesale clients.