How to Trade Divergences and other Important Indicator Signals
There are a number of important indicator trading signals apart from overbought and oversold levels.
Overbought/Oversold Levels
Overbought and Oversold levels are peculiar to Momentum Oscillators, with each indicator likely to have different levels for different time frames.
The original concept started with traders selling when the indicator crossed above the overbought level and buying when it crossed below the oversold level. A later variation recognized that the original signals were often too early and attempted to rectify this by buying when the indicator crossed back above the oversold level and selling when it crossed back to below the overbought level.
Example: Slow Stochastic – Overbought/Oversold Levels
The chart below shows Sprott Uranium Physical Trust (SRUUF) in a ranging market in 2022. The indicator is Slow Stochastic with a red signal line.
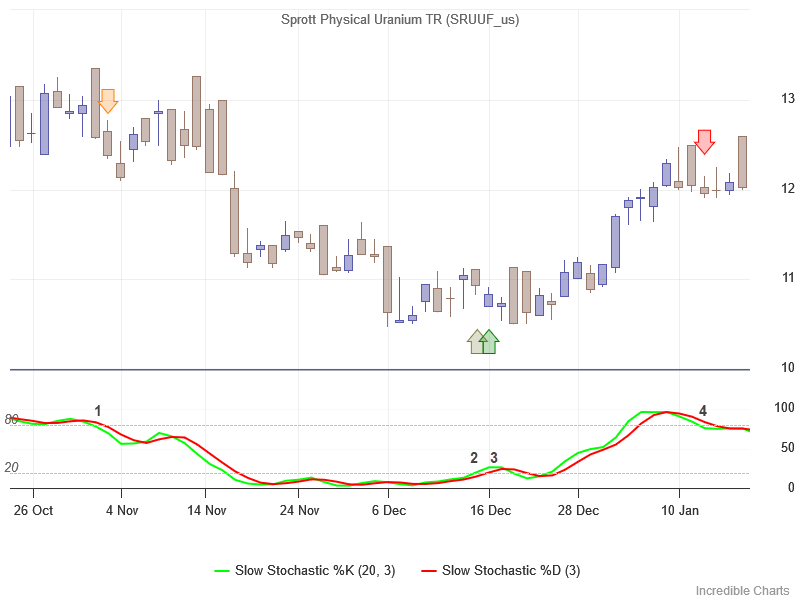
- Go short when the signal line (red) crosses below the 80 overbought level.
- Exit when the Stochastic (lime) crosses to above the 20 oversold level.
- Go long when the signal line crosses above 20.
- Exit when the Stochastic crosses to below 80.
Stochastic Pop
A further variation was developed by Jake Bernstein for trading trends. Known as the Stochastic Pop, entries are taken when the oscillator crosses above the overbought level — originally 80 on the Stochastic Oscillator — and exited when it crosses back below that level. A similar strategy can be used on the RSI oscillator in longer time frames.
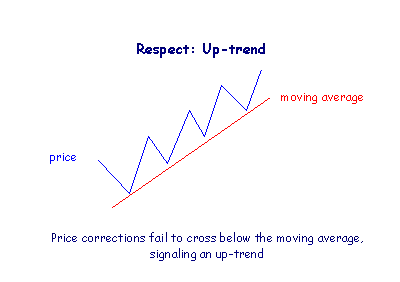
Respect
If price reverses direction when it reaches a moving average or trend line we say that price has respected the moving average or trend line.
Respect of a moving average confirms that price is trending.
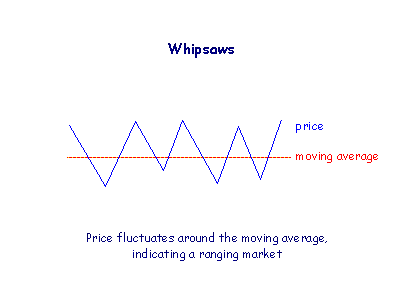
Whipsaws
If price fluctuates around a moving average, frequently crossing above and below, that is referred to as whipsawing.
Price whipsawing around a moving average indicates a ranging market.
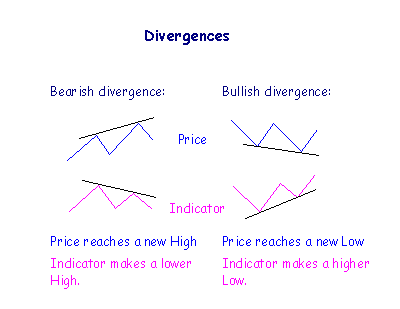
Divergence
Many indicators tend to imitate the peaks and troughs on the price chart with a series of similar highs and lows. Divergence occurs when the indicator fails to imitate the pattern on the price chart, a sign of trend weakness and likely reversal.
In an up-trend, if price makes a new High (a higher peak than the last) but the indicator fails to do so, that is a bearish divergence.
In a down-trend, if price makes a new Low (a lower trough than the last) but the indicator does not, a bullish divergence occurs.
Unless supported by other indicators, ignore weaker divergences where:
- Price makes an equal High (a double top) and the indicator makes a lower High or price makes an equal Low (a double bottom) and the indicator makes a higher Low; or
- Price reaches a new High and the indicator makes an equal High or price reaches a new Low and the indicator makes an equal low; or
- Peaks or troughs are only marginally different in height (if you need a ruler to distinguish which is higher).
Failure Swing
Failure swings, in overbought or oversold territory, signal that a trend is weakening and likely to reverse. They also add weight to other signals and are identified by either:
- A trough [LL] below the oversold level,
- followed by an intervening peak that does not reach the overbought level,
- then a higher second trough [HL].
- To complete the failure swing the indicator must then rise above the intervening peak.
OR
- A peak [HH] above the overbought level,
- followed by an intervening trough that does not reach the oversold level,
- then a lower second peak [LH].
- To complete the failure swing the indicator must then fall below the intervening trough.
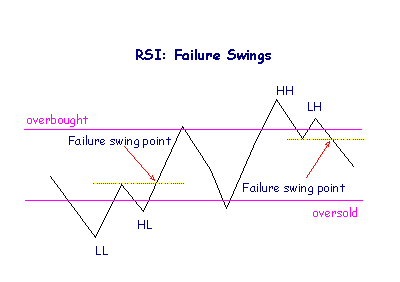
This pattern of highs and lows is identical to a trend reversal on a price chart.
The signal is strongest when the second peak (or trough) is also above the Overbought level (below the Oversold level), though this is not essential for a valid failure swing.
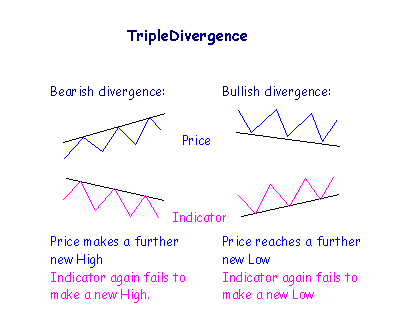
Triple Divergence
A triple divergence only occurs where a divergence has given an incorrect signal. Instead of reversing direction, price has made a new, higher High (in an up-trend) or lower Low (in a down-trend). If the indicator repeats its signal by making another lower High (in an up-trend) or higher Low (in a down-trend), this is an even stronger signal than the original divergence.
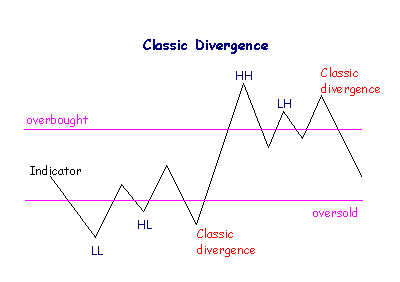
Classic Divergence
George Lane identified a weaker form of triple divergence, on the Stochastic indicator, where the third peak is higher than the second.
Conclusion
Always be on the lookout for price respecting a moving average, divergences between price action and momentum oscillators, and failure swings. Apart from Overbought and Oversold signals, these are useful tools that often provide early warning of an impending change.

Author: Colin Twiggs is a former investment banker with almost 40 years of experience in financial markets. He co-founded Incredible Charts and writes the popular Trading Diary and Patient Investor newsletters.
Using a top-down approach, Colin identifies key macro trends in the global economy before evaluating selected opportunities using a combination of fundamental and technical analysis.
Focusing on interest rates and financial market liquidity as primary drivers of the economic cycle, he warned of the 2008/2009 and 2020 bear markets well ahead of actual events.
He founded PVT Capital (AFSL No. 546090) in May 2023, which offers investment strategy and advice to wholesale clients.