Elder Ray Index
Developed by Dr Alexander Elder, the Elder-ray indicator measures buying and selling pressure in the market. The Elder-ray is often used as part of the Triple Screen trading system but may also be used on its own.
Dr Elder uses a 13-day exponential moving average (EMA) to indicate the market consensus of value. Bull Power measures the ability of buyers to drive prices above the consensus of value. Bear Power reflects the ability of sellers to drive prices below the average consensus of value.
Bull Power is calculated by subtracting the 13-day EMA from the day's High. Bear power subtracts the 13-day EMA from the day's Low.
Elder Ray Index Trading Signals
When used on its own, the Elder-ray requires 3 screens:
- A bar chart with 13-day exponential moving average;
- Elder Ray Bull Power; and
- Elder Ray Bear Power.
Only trade in the direction of the trend - indicated by the slope of the 13-day EMA.
- Go long if Bear Power is below zero and there is a bullish
divergence.
- Go short if Bull Power is above zero and there is a bearish divergence.
Further trading rules can be found in Trading For A Living by Dr Alexander Elder.
If you wish to pyramid your position:
- Increase your long position whenever Bear Power dips below zero and then
rises back into positive.
- Increase your short position whenever Bull Power rises above zero and then falls back into negative.
Example
The All Ordinaries Index (Australia) is shown with 13-day exponential moving average (EMA) and Elder Ray Bull & Bear Power.
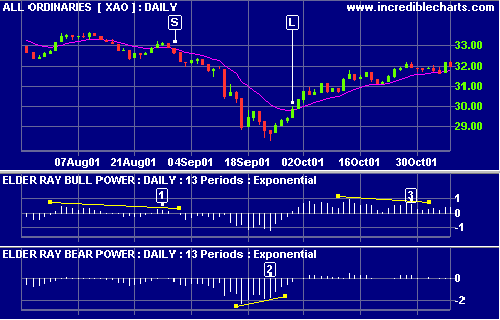
Mouse over chart captions to display trading signals.
- Go short [S] on bearish divergence on Bull Power. Wait for the EMA to turn downwards.
- Go long [L] on bullish divergence on Bear Power. Wait for the EMA to turn upwards.
- Bearish divergence on Bull Power but no trade is entered - the EMA does not turn down.
Setup
See Indicator Panel for directions on how to set up an indicator. The default settings for Elder Ray are :
- 13-day exponential moving average.
To alter the default settings - Edit Indicator Settings.

Author: Colin Twiggs is a former investment banker with almost 40 years of experience in financial markets. He co-founded Incredible Charts and writes the popular Trading Diary and Patient Investor newsletters.
Using a top-down approach, Colin identifies key macro trends in the global economy before evaluating selected opportunities using a combination of fundamental and technical analysis.
Focusing on interest rates and financial market liquidity as primary drivers of the economic cycle, he warned of the 2008/2009 and 2020 bear markets well ahead of actual events.
He founded PVT Capital (AFSL No. 546090) in May 2023, which offers investment strategy and advice to wholesale clients.