Slow Stochastic
The Slow Stochastic applies further smoothing to the Stochastic oscillator, to reduce volatility and improve signal accuracy.
Trading Signals
Trading signals are the same as for the Stochastic oscillator.
Ranging Markets
Signals are listed in order of their importance:
- Go long on bullish divergence (on %D) where the first trough is below the Oversold level.
- Go long when %K or %D falls below the Oversold level and rises back above it.
- Go long when %K crosses to above %D.
Short signals:
- Go short on bearish divergence (on %D) where the first peak is above the Overbought level.
- Go short when %K or %D rises above the Overbought level then falls back below it.
- Go short when %K crosses to below %D.
Place stop-losses below the most recent minor Low (or above the most recent minor High) when going long (or short).
Trending Markets
Only take signals in the direction of the trend and never go long when Stochastic is overbought, nor short when oversold.
The shape of a Stochastic bottom gives some indication of the ensuing rally. A narrow bottom that is not very deep indicates that bears are weak and that the following rally should be strong. A broad, deep bottom signals that bears are strong and that the rally should be weak.
The same applies to Stochastic tops. Narrow tops indicate that the bulls are weak and that the correction is likely to be severe. High, wide tops indicate that bulls are strong and the correction is likely to be weak.
Use trailing buy- and sell-stops to enter trades and protect yourself with stop-losses.
Long:
If the Stochastic (%K or %D) falls below the Oversold line, place a trailing buy stop. When you are stopped in, place a stop loss below the Low of the recent down-trend (the lowest Low since the signal day).
Short:
If Stochastic rises above the Overbought line, place a trailing short stop. When you are stopped in, place a stop loss above the High of the recent up-trend (the highest High since the signal day).
Exit:
Use a trend indicator to exit.
Example
Johnson & Johnson is plotted with a 21 day exponential moving average (MA) and 5 day Slow Stochastic with %K and %D. Overbought/oversold levels are set at 70/30. Closing price is used as a filter on the MA.
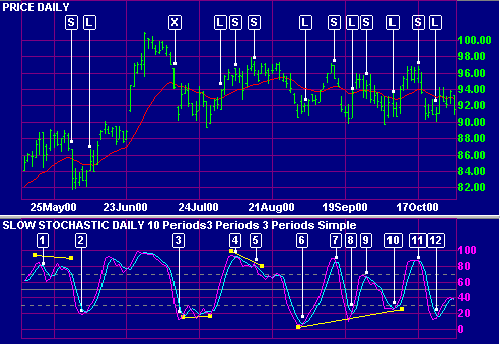
Mouse over chart captions to display trading signals.
- The market is trending upwards (price above the MA). %K twice crosses to above 80. Wait until the MA turns down before going short [S].
- %K crosses to below 20. Go long [L] when the MA turns upwards. Exit [X] when price closes below the MA.
- %K crosses to below 20. Go long [L] when the MA turns upwards.
- Price has been fluctuating around the MA
which indicates that the market is ranging. Adjust the trading signals
and overbought/oversold levels.
Go short [S] when %K crosses to below % D. The trade is stopped out by a rally above the last minor High. - A bearish divergence on %D signals to re-instate the short [S] position.
- %K crosses to above %D, signaling to go long [L].
- %K signals to go short [S] when it crosses below %D.
- A bullish divergence on %D signals to go long [L].
- %K rises above 70 and turns back below. Go short [S].
- There is a bullish, triple divergence on %D. Go long [L].
- %K crosses to below % D. Go short [S].
- Go long [L] when %K crosses to above %D. The market is still ranging, with price fluctuating around the MA.
Remember that the days shown are the signal days and that trades are only entered on the following day. Take a look at the exit [X] from [2]. Adjusting Stop Levels may provide faster exits.
Setup
See Indicator Panel for directions on how to set up an indicator. The default Slow Stochastic settings are:
- %K - 5 days
- %K slowing periods - 3 days
- %D - 3 days
- All are simple moving averages
- overbought level - 70%
- oversold level - 30%
To alter default settings - see Edit Indicator Settings.
Formula
To calculate the Stochastic Oscillator:
- The first step is to decide on the number of periods (%K Periods) to be included in the calculation. The norm is 5 days, but this should be based on the time frame that you are analyzing.
- Then calculate %K, by comparing the latest Closing price to the range
traded over the selected period:
CL = Close [today] - Lowest Low [in %K Periods]
HL =Highest High [in %K Periods] - Lowest Low [in %K Periods]
%K = CL / HL *100 - Calculate %D by smoothing %K. The original formula used a 3 period simple moving average, but this can be varied, based on the time frame that you are analyzing.
Slow Stochastic Oscillator
Many traders find the Stochastic Oscillator too volatile and prefer to use the Slow Stochastic:
- The %K [Slow] is equal to the %D [Fast] from the above formula.
- The %D [Slow] is calculated by smoothing %K [Slow]. This is normally done using a further 3 period simple moving average.

Author: Colin Twiggs is a former investment banker with almost 40 years of experience in financial markets. He co-founded Incredible Charts and writes the popular Trading Diary and Patient Investor newsletters.
Using a top-down approach, Colin identifies key macro trends in the global economy before evaluating selected opportunities using a combination of fundamental and technical analysis.
Focusing on interest rates and financial market liquidity as primary drivers of the economic cycle, he warned of the 2008/2009 and 2020 bear markets well ahead of actual events.
He founded PVT Capital (AFSL No. 546090) in May 2023, which offers investment strategy and advice to wholesale clients.