MACD Histogram
The signals from the MACD indicator tend to lag price movements. The MACD Histogram attempts to address this problem by plotting the distance between MACD and its signal line. Because of this, the histogram signals trend changes well in advance of the normal MACD signal, but is less reliable and should be confirmed by other indicators.
Only trade with Histogram signals when the market is trending.
The MACD Histogram can also be used to track longer cycles, using weekly or monthly data.
Trading Signals
Use Stop Losses with all trades.
Ranging Markets
Signals are stronger if
- There is a bullish divergence on the Histogram; or
- The signal occurs far from the zero line.
Disregard signals close to the zero line unless confirmed by a divergence.
- Go long when the MACD Histogram turns up below zero.
Close the position when there is a signal to go short.
- Go short when MACD Histogram turns down above zero.
Close the position when there is a signal to go long.
Trending Markets
Only trade in the direction of the trend. Signals close to the zero line are accepted provided the trend is intact.
- Go long when the MACD Histogram turns up below zero.
- Go short when MACD Histogram turns down above zero.
Use a trend indicator, such as a moving average, to exit from trends.
Example
Intel Corporation is shown with MACD histogram and 21-day exponential moving average. Trendlines show divergences.
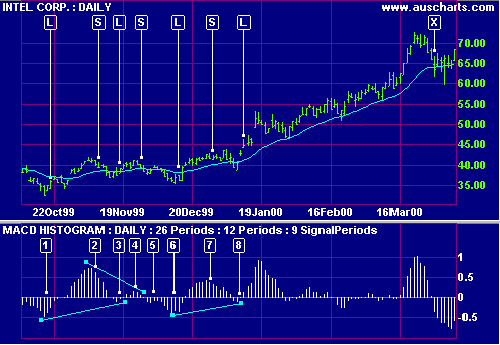
Mouse over chart captions to display trading signals.
- Price is ranging - indicated by the flat MA. Go long [L] when the histogram turns up (far from the zero line). Place a stop below the recent Low.
- Go short [S] as the histogram turns down (far from the zero line). Place a stop above the recent High.
- Go long [L] - the histogram turns up and is reinforced by a bullish divergence. Place a stop below the recent Low.
- Go short [S] as the histogram turns down - reinforced by a bearish divergence. Place a stop above the recent High.
- Ignore the signal as it is too close to the zero line.
- Go long [L] as the histogram turns up when well below zero. Place a stop below the recent Low.
- A further signal to go short [S]. Place a stop above the recent High.
- Go long [L] - the histogram has turned up and is reinforced by a bullish divergence. Price has broken clear of the trading range and the MA is rising - exit [X] when price closes below the MA.
Setup
The default settings are:
- Slow moving average - 26 days
- Fast moving average - 12 days
- Signal line - 9 day moving average of the difference between fast and slow.
- All moving averages are exponential.
To alter the default settings - see Edit Indicator Settings. See Indicator Panel for directions on how to set up an indicator.
Captions and trendlines: Do not use MACD if you want to draw trendlines or place captions on the histogram. These are left "hanging in the air" if you zoom or change time periods.
Formula
To calculate the MACD Histogram:
Microsoft Corporation is plotted with MACD, MACD signal line and MACD Histogram.
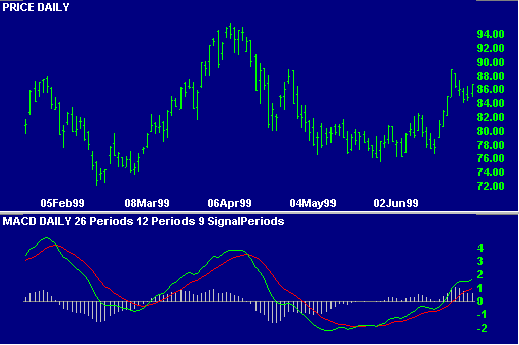
The MACD histogram is calculated as the MACD indicator minus the signal line. Observe that:
- When MACD is above the signal line then the histogram is positive.
- When MACD is below the signal line then the histogram is negative.
- When the gap between the MACD and its signal line is widest then the histogram registers its highest (or lowest) readings.
- The histogram is at zero when MACD and the signal line cross (the signal for trading with the MACD).
- The histogram turns back towards the zero line when MACD and the signal line converge, well in advance of them actually crossing.

Author: Colin Twiggs is a former investment banker with almost 40 years of experience in financial markets. He co-founded Incredible Charts and writes the popular Trading Diary and Patient Investor newsletters.
Using a top-down approach, Colin identifies key macro trends in the global economy before evaluating selected opportunities using a combination of fundamental and technical analysis.
Focusing on interest rates and financial market liquidity as primary drivers of the economic cycle, he warned of the 2008/2009 and 2020 bear markets well ahead of actual events.
He founded PVT Capital (AFSL No. 546090) in May 2023, which offers investment strategy and advice to wholesale clients.