Median Price
Median Price is merely the mid-point of the trading range for each period.
Calculated as: (High + Low ) / 2
The line is plotted on the price chart and can be used as a filter for trend indicators.
Median Price is featured in Steven Achelis' book, Technical Analysis A-Z.
Example
Coca Cola is plotted with 21-day exponential moving average, and daily median price.
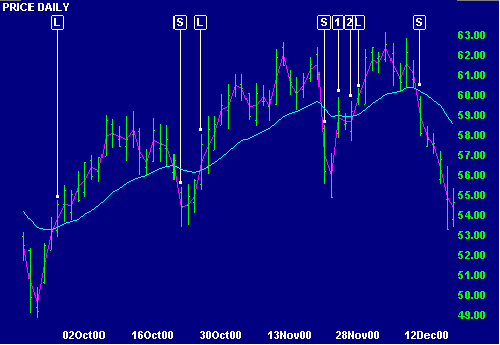
Mouse over chart captions to display trading signals.
A Single Moving Average System is used with median price as a filter. Long [L] and short [S] trades are signaled when median price crosses the moving average. The median price filter eliminates an unprofitable trade at [1] but delays the signal by an extra day at [2].
Setup
See Indicator Panel for directions on how to set up a median price on the price chart. Edit Indicator Settings to alter the default settings.

Author: Colin Twiggs is a former investment banker with almost 40 years of experience in financial markets. He co-founded Incredible Charts and writes the popular Trading Diary and Patient Investor newsletters.
Using a top-down approach, Colin identifies key macro trends in the global economy before evaluating selected opportunities using a combination of fundamental and technical analysis.
Focusing on interest rates and financial market liquidity as primary drivers of the economic cycle, he warned of the 2008/2009 and 2020 bear markets well ahead of actual events.
He founded PVT Capital (AFSL No. 546090) in May 2023, which offers investment strategy and advice to wholesale clients.