Moving Average Oscillator
One of our subscribers, George Topalides, asked me to set up an oscillator to reflect the variation between price and its moving average. After some discussion, we decided on a simple Moving Average Oscillator that reflects the variance between price and the moving average as a percentage of the MA. The indicator should be used in conjunction with the same moving average, plotted on the price chart, and is used to signal entries and exits in a trend-following system.
Moving Average Oscillator Trading Signals
The Moving Average Oscillator may be used in trending and ranging markets.
Trending Markets
- Go long on a bullish divergence where the second dip does not cross below the Oversold line.
- Go long when a downward trendline on the Moving Average Oscillator is broken and the Oscillator crosses to above zero.
- Exit long positions if the Moving Average Oscillator crosses below the Overbought line from above.
- Go short on a bearish divergence where the second peak does not cross above the Overbought line.
- Go short when an upward trendline on the Moving Average Oscillator is broken and the Oscillator crosses to below zero.
- Exit short positions if the Moving Average Oscillator turns up from below the Overbought line.
Overbought/Oversold Lines
Suggested values for the Overbought/Oversold lines are:
- 63-day MA Oscillator: 50%/-50%;
- 50-day MA Oscillator: 40%/-40%;
- 21-day MA Oscillator: 20%/-20% or 10%/-10% for large caps; and
- 10-day MA Oscillator: 10%/-10% or 5%/-5% for large caps.
Example
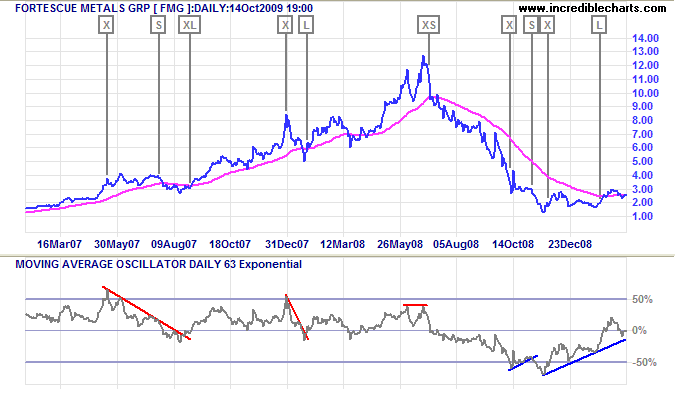
Australian miner Fortescue Metals Group [FMG] is displayed with 63-day Moving Average Oscillator and 63-day exponential moving average.

Mouse over chart captions to display trading signals.
- Exit [X] from previous long trade when Moving Average Oscillator turns down while above 50%; bearish divergence later strengthens the signal
- Bearish triple divergence gives a signal to go short [S] (while still above the 63-day exponential moving average)
- Exit and go long [XL] when price crosses above the 63-day exponential moving average after breaking the downward trendline
- Exit [X] long position when Moving Average Oscillator turns down while above 50%
- Go long [L] when price crosses above the 63-day exponential moving average after breaking the downward trendline
- Bearish divergence (below 50%) warns to exit long trade [XS]; go short when price crosses below the 63-day exponential moving average
- Exit [X] short position when the Moving Average Oscillator turns up while below -50%
- Go short [S] when the Moving Average Oscillator reverses below the rising trendline and reverses below -50%
- Exit [X] when the Moving Average Oscillator turns up while below -50%
- Bullish triple divergence gives a signal to go long [L] while still below the 63-day exponential moving average.
Note that price crossing the 63-day exponential moving average is equivalent to the Moving Average Oscillator crossing zero.
Setup
Setup for the Moving Average Oscillator is simple. The default time period is 21 days, but I prefer 63 days for longer trends. We recommend using the default exponential moving average as this gives more reliable signals than a simple moving average.
See Indicator Panel for directions on how to set up an indicator.
Moving Average Oscillator Formula
The formula is simply (Close - Exponential MA) / Exponential MA expressed as a percentage.
Evaluation
A simple but useful tool.

Author: Colin Twiggs is a former investment banker with almost 40 years of experience in financial markets. He co-founded Incredible Charts and writes the popular Trading Diary and Patient Investor newsletters.
Using a top-down approach, Colin identifies key macro trends in the global economy before evaluating selected opportunities using a combination of fundamental and technical analysis.
Focusing on interest rates and financial market liquidity as primary drivers of the economic cycle, he warned of the 2008/2009 and 2020 bear markets well ahead of actual events.
He founded PVT Capital (AFSL No. 546090) in May 2023, which offers investment strategy and advice to wholesale clients.
