Percentage Trailing Stops
Percentage Trailing Stops is a simple trend-following system that trails a stop loss above/below the current price, depending on trend direction. The system uses a stop-and-reverse mechanism similar to Welles Wilder's Parabolic SAR or Average True Range Trailing Stops.
Percentage Trailing Stop Signals
The signals are used for exits.
- Exit your long position when price crosses below the Percentage Trailing Stop line.
- Exit your short position when price crosses above the Percentage Trailing Stop line.
Example
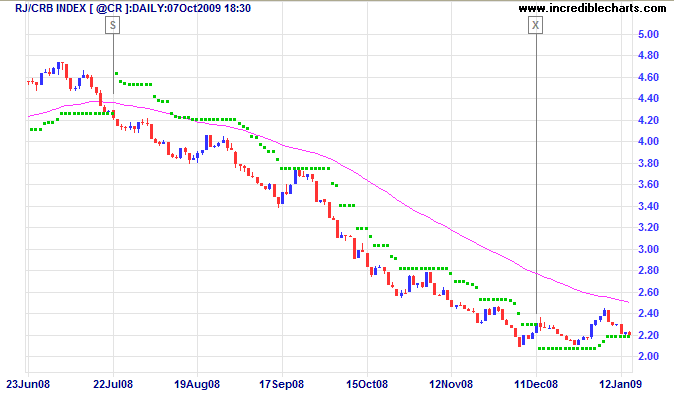
The RJ CRB Commodities Index late 2008 down-trend is displayed with Percentage Trailing Stop (10%, Closing Price) and 63-day exponential moving average used as a trend filter.
Mouse over chart captions to display trading signals.
- Go short [S] when price closes below the 63-day moving average and the trailing stop
- Exit [X] when price crosses above the ATR stop
Setup
The default is set as 10 percent.
Closing Price is set as the default option. The alternative is High/Low (see Formula below).
See Indicator Panel for directions on how to set up an indicator — and Edit Indicator Settings to change the settings.
Percentage Trailing Stops Formula
Trailing stops are normally calculated using closing prices:
- In an up-trend, subtract 10 percent from the Closing Price and plot the result as the stop for the following day
- If price closes below trailing stop, add 10 percent to the Closing Price — to track a Short trade
- Otherwise, continue subtracting 10 percent from Closing Price each day until price reverses below the trailing stop
- There is also built in a ratchet mechanism so that ATR stops do not move lower during a Long trade nor rise during a Short trade.
If you select the High/Low option, the trailing stop is calculated using the daily High in an up-trend — and the daily Low in a down-trend.
Evaluation
More volatile stocks require larger percentages. Down-trends are also more volatile than up-trends and may need wider percentage stops.

Author: Colin Twiggs is a former investment banker with almost 40 years of experience in financial markets. He co-founded Incredible Charts and writes the popular Trading Diary and Patient Investor newsletters.
Using a top-down approach, Colin identifies key macro trends in the global economy before evaluating selected opportunities using a combination of fundamental and technical analysis.
Focusing on interest rates and financial market liquidity as primary drivers of the economic cycle, he warned of the 2008/2009 and 2020 bear markets well ahead of actual events.
He founded PVT Capital (AFSL No. 546090) in May 2023, which offers investment strategy and advice to wholesale clients.